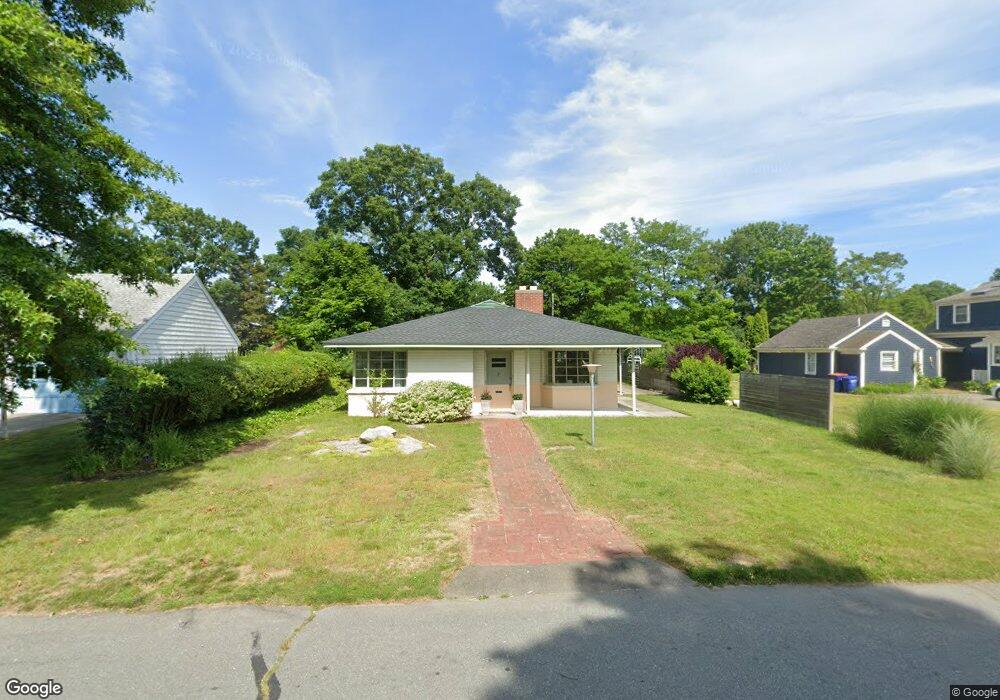
7 Laurel St Fairhaven, MA 02719
Estimated Value: $519,241 - $600,000
3
Beds
1
Bath
1,678
Sq Ft
$334/Sq Ft
Est. Value
About This Home
This home is located at 7 Laurel St, Fairhaven, MA 02719 and is currently estimated at $560,560, approximately $334 per square foot. 7 Laurel St is a home located in Bristol County with nearby schools including Fairhaven High School, City On A Hill Charter Public School New Bedford, and St. Joseph School.
Ownership History
Date
Name
Owned For
Owner Type
Purchase Details
Closed on
Jun 13, 2023
Sold by
Duval Christopher E
Bought by
Christopher E Duval Ret and Duval
Current Estimated Value
Purchase Details
Closed on
Apr 4, 1997
Sold by
Macisaac Drake B and Macisaac Judith
Bought by
Duval Christopher E
Home Financials for this Owner
Home Financials are based on the most recent Mortgage that was taken out on this home.
Original Mortgage
$80,000
Interest Rate
7.5%
Mortgage Type
Purchase Money Mortgage
Create a Home Valuation Report for This Property
The Home Valuation Report is an in-depth analysis detailing your home's value as well as a comparison with similar homes in the area
Home Values in the Area
Average Home Value in this Area
Purchase History
| Date | Buyer | Sale Price | Title Company |
|---|---|---|---|
| Christopher E Duval Ret | -- | None Available | |
| Duval Christopher E | $111,000 | -- |
Source: Public Records
Mortgage History
| Date | Status | Borrower | Loan Amount |
|---|---|---|---|
| Previous Owner | Duval Christopher E | $67,000 | |
| Previous Owner | Duval Christopher E | $80,000 |
Source: Public Records
Tax History
| Year | Tax Paid | Tax Assessment Tax Assessment Total Assessment is a certain percentage of the fair market value that is determined by local assessors to be the total taxable value of land and additions on the property. | Land | Improvement |
|---|---|---|---|---|
| 2025 | $41 | $440,500 | $245,600 | $194,900 |
| 2024 | $3,846 | $416,700 | $245,600 | $171,100 |
| 2023 | $3,640 | $365,800 | $211,800 | $154,000 |
| 2022 | $3,409 | $333,600 | $192,900 | $140,700 |
| 2021 | $3,274 | $290,000 | $175,400 | $114,600 |
| 2020 | $3,207 | $290,000 | $175,400 | $114,600 |
| 2019 | $3,062 | $262,400 | $150,300 | $112,100 |
| 2018 | $4,169 | $250,100 | $143,000 | $107,100 |
| 2017 | $4,038 | $240,000 | $137,600 | $102,400 |
| 2016 | $2,829 | $232,300 | $134,900 | $97,400 |
| 2015 | $2,803 | $230,700 | $134,900 | $95,800 |
Source: Public Records
Map
Nearby Homes
- 32 Cedar St
- 32 Green St
- 2 Washburn Ave
- 11 Lawton St
- 24 Middle St
- 58 Washington St
- 0 Nulands Neck Unit 73286360
- 8 Washington St
- 145 Pleasant St
- 8 Manor Dr
- 58 Bayview Ave
- 39 Christian St
- 77 Adams St
- 181 Washington St
- 27 Bayview Ave
- 67 Bridge St
- 15 Bayview Ave
- 9 Abbott St
- 9 Cleveland St
- 138 Main St Unit 13
Your Personal Tour Guide
Ask me questions while you tour the home.