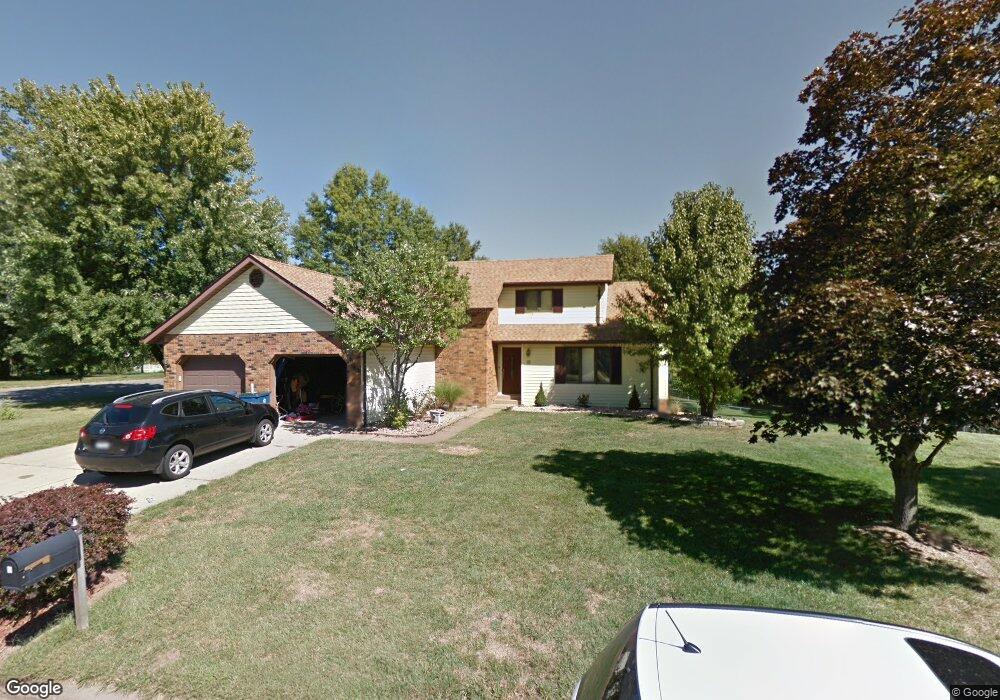
7 Linden Ct Bethalto, IL 62010
Estimated Value: $256,452 - $290,000
3
Beds
2
Baths
1,683
Sq Ft
$161/Sq Ft
Est. Value
About This Home
This home is located at 7 Linden Ct, Bethalto, IL 62010 and is currently estimated at $270,863, approximately $160 per square foot. 7 Linden Ct is a home located in Madison County with nearby schools including Bethalto East Primary School, Parkside Primary School, and Meadowbrook Intermediate School.
Ownership History
Date
Name
Owned For
Owner Type
Purchase Details
Closed on
Oct 28, 2008
Sold by
The Secretary Of Housing & Urban Develop
Bought by
Schwab David
Current Estimated Value
Home Financials for this Owner
Home Financials are based on the most recent Mortgage that was taken out on this home.
Original Mortgage
$110,000
Outstanding Balance
$70,341
Interest Rate
5.73%
Mortgage Type
Purchase Money Mortgage
Estimated Equity
$200,522
Purchase Details
Closed on
May 6, 2008
Sold by
Martin Michael K
Bought by
Hud
Purchase Details
Closed on
Aug 29, 2005
Sold by
Ryan Michael J and Ryan Vicki L
Bought by
Martin Michael K and Martin Jill R
Home Financials for this Owner
Home Financials are based on the most recent Mortgage that was taken out on this home.
Original Mortgage
$166,152
Interest Rate
5.82%
Mortgage Type
FHA
Create a Home Valuation Report for This Property
The Home Valuation Report is an in-depth analysis detailing your home's value as well as a comparison with similar homes in the area
Home Values in the Area
Average Home Value in this Area
Purchase History
| Date | Buyer | Sale Price | Title Company |
|---|---|---|---|
| Schwab David | -- | Lakeside Title & Escrow Agen | |
| Hud | -- | None Available | |
| Martin Michael K | $168,500 | Community Title & Escrow Ltd |
Source: Public Records
Mortgage History
| Date | Status | Borrower | Loan Amount |
|---|---|---|---|
| Open | Schwab David | $110,000 | |
| Previous Owner | Martin Michael K | $166,152 |
Source: Public Records
Tax History Compared to Growth
Tax History
| Year | Tax Paid | Tax Assessment Tax Assessment Total Assessment is a certain percentage of the fair market value that is determined by local assessors to be the total taxable value of land and additions on the property. | Land | Improvement |
|---|---|---|---|---|
| 2024 | $5,050 | $77,680 | $16,330 | $61,350 |
| 2023 | $5,050 | $72,410 | $15,220 | $57,190 |
| 2022 | $4,851 | $51,500 | $14,050 | $37,450 |
| 2021 | $3,209 | $48,010 | $13,100 | $34,910 |
| 2020 | $3,155 | $46,240 | $12,620 | $33,620 |
| 2019 | $3,094 | $44,860 | $12,240 | $32,620 |
| 2018 | $3,033 | $42,630 | $11,630 | $31,000 |
| 2017 | $2,798 | $38,540 | $11,350 | $27,190 |
| 2016 | $2,775 | $38,540 | $11,350 | $27,190 |
| 2015 | $2,658 | $38,130 | $11,230 | $26,900 |
| 2014 | $2,658 | $38,130 | $11,230 | $26,900 |
| 2013 | $2,658 | $38,680 | $11,390 | $27,290 |
Source: Public Records
Map
Nearby Homes
- 527 Strohbeck Ln
- 1414 West Dr
- 118 Whispering Oaks Dr
- 205 Wrigley Field Dr
- 207 Wrigley Field Dr
- 206 Wrigley Field Dr
- 628 Valley View Dr
- 116 Valleywood Ct
- 927 W Corbin St
- 0 Sage Creek Lots Unit 19013762
- 416 Albers Place
- 133 Blair Ave
- 334 Silver St
- 600 Mill St
- 71 N Lincoln Ave
- 758 2nd St
- 330 Grant St
- 602 N Walnut St
- 800 Block Prairie St
- 1122 East Dr
- 405 Whispering Oaks Dr
- 6 Linden Ct
- 4 Linden Ct
- 2 Linden Ct
- 409 Whispering Oaks Dr
- 1 Linden Ct
- 3 Linden Ct
- 5 Linden Ct
- 8 Hawthorn Ct
- 413 Whispering Oaks Dr
- 406 Whispering Oaks Dr
- 1 Hawthorn Ct
- 5 Redbud Ct
- 7 Hawthorn Ct
- 4 Redbud Ct
- 6 Redbud Ct
- 339 Whispering Oaks Dr
- 366 Whispering Oaks Dr
- 505 Whispering Oaks Dr
- 4 Chestnut Ct