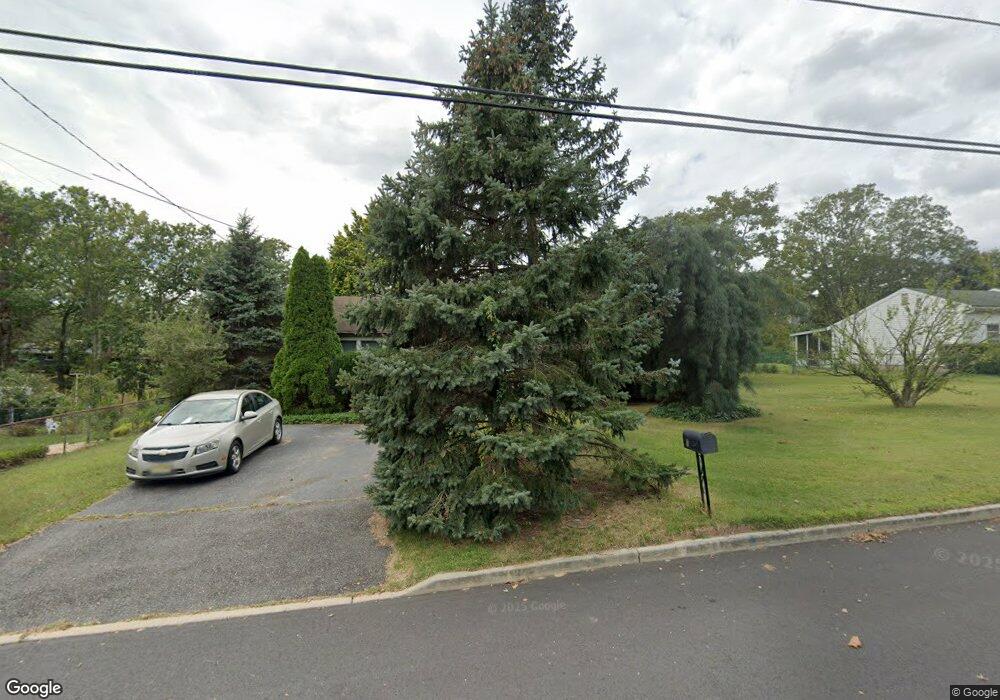
7 Locust Rd Howell, NJ 07731
Land of Pines NeighborhoodEstimated Value: $421,000 - $491,000
3
Beds
1
Bath
960
Sq Ft
$464/Sq Ft
Est. Value
About This Home
This home is located at 7 Locust Rd, Howell, NJ 07731 and is currently estimated at $445,442, approximately $464 per square foot. 7 Locust Rd is a home located in Monmouth County with nearby schools including Land O' Pines School, Newbury School, and Howell Middle School North.
Ownership History
Date
Name
Owned For
Owner Type
Purchase Details
Closed on
Nov 17, 2011
Sold by
Votto Glenn T and Votto Lisa A
Bought by
Votto Glenn T
Current Estimated Value
Home Financials for this Owner
Home Financials are based on the most recent Mortgage that was taken out on this home.
Original Mortgage
$168,000
Outstanding Balance
$115,001
Interest Rate
4.1%
Mortgage Type
New Conventional
Estimated Equity
$330,441
Purchase Details
Closed on
May 10, 2000
Sold by
Waielcyzk Carol
Bought by
Votto Glenn and Votto Lisa
Home Financials for this Owner
Home Financials are based on the most recent Mortgage that was taken out on this home.
Original Mortgage
$104,700
Interest Rate
8.19%
Purchase Details
Closed on
Oct 18, 1995
Sold by
Reverendo Joaquim
Bought by
Wasielczyk Carol
Home Financials for this Owner
Home Financials are based on the most recent Mortgage that was taken out on this home.
Original Mortgage
$101,000
Interest Rate
7.53%
Create a Home Valuation Report for This Property
The Home Valuation Report is an in-depth analysis detailing your home's value as well as a comparison with similar homes in the area
Home Values in the Area
Average Home Value in this Area
Purchase History
| Date | Buyer | Sale Price | Title Company |
|---|---|---|---|
| Votto Glenn T | -- | Rms Title Services Llc | |
| Votto Glenn | $128,000 | -- | |
| Wasielczyk Carol | $112,000 | -- |
Source: Public Records
Mortgage History
| Date | Status | Borrower | Loan Amount |
|---|---|---|---|
| Open | Votto Glenn T | $168,000 | |
| Closed | Votto Glenn | $104,700 | |
| Previous Owner | Wasielczyk Carol | $101,000 |
Source: Public Records
Tax History
| Year | Tax Paid | Tax Assessment Tax Assessment Total Assessment is a certain percentage of the fair market value that is determined by local assessors to be the total taxable value of land and additions on the property. | Land | Improvement |
|---|---|---|---|---|
| 2025 | $7,118 | $438,400 | $307,200 | $131,200 |
| 2024 | $6,666 | $401,000 | $272,200 | $128,800 |
| 2023 | $6,666 | $358,000 | $232,200 | $125,800 |
| 2022 | $5,410 | $282,000 | $162,200 | $119,800 |
| 2021 | $5,410 | $248,800 | $142,200 | $106,600 |
| 2020 | $5,529 | $237,800 | $132,200 | $105,600 |
| 2019 | $5,510 | $232,500 | $128,700 | $103,800 |
| 2018 | $5,422 | $227,700 | $128,700 | $99,000 |
| 2017 | $5,413 | $224,700 | $128,700 | $96,000 |
| 2016 | $5,324 | $218,100 | $126,200 | $91,900 |
| 2015 | $4,849 | $196,700 | $107,200 | $89,500 |
| 2014 | $5,221 | $196,500 | $125,400 | $71,100 |
Source: Public Records
Map
Nearby Homes
- 9 Spruce Rd
- 21 Christopher Dr
- 4 Christopher Dr
- 2 Northgate Dr
- 6 Reuben Ct
- 43 Darien Rd
- 28 Salem Hill Rd
- 274 Aldrich Rd
- 138 Windeler Rd
- 2 Lyndon Ln
- 31 Southport Dr
- 0 Windeler Rd Unit 22523932
- 254 Aldrich Rd
- 16 Diamond Ln
- 8 Coral Dr
- 21 Julies Way
- 10 Lexington Rd
- 9 Chatham Dr
- 47 Sun Hollow Rd
- 8 Cindy Ct
Your Personal Tour Guide
Ask me questions while you tour the home.