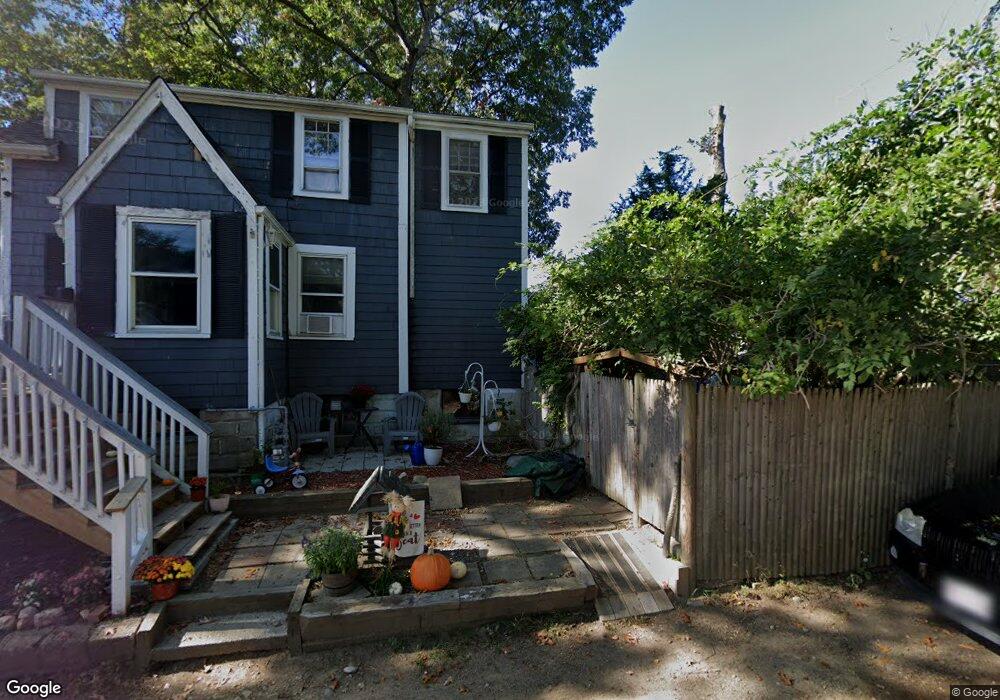
7 Locust St Dedham, MA 02026
The Manor NeighborhoodEstimated Value: $603,130 - $695,000
3
Beds
1
Bath
1,147
Sq Ft
$558/Sq Ft
Est. Value
About This Home
This home is located at 7 Locust St, Dedham, MA 02026 and is currently estimated at $640,283, approximately $558 per square foot. 7 Locust St is a home located in Norfolk County with nearby schools including Greenlodge Elementary School, Dedham Middle School, and Dedham High School.
Ownership History
Date
Name
Owned For
Owner Type
Purchase Details
Closed on
Mar 1, 2023
Sold by
Gonski Chester R
Bought by
Gonski Chester R and Gonski Steven R
Current Estimated Value
Purchase Details
Closed on
Sep 9, 2022
Sold by
Gonski Chester R
Bought by
Gonski Christine A and Gonski Richard M
Purchase Details
Closed on
Feb 20, 1976
Bought by
Stormy Hill Rt
Create a Home Valuation Report for This Property
The Home Valuation Report is an in-depth analysis detailing your home's value as well as a comparison with similar homes in the area
Home Values in the Area
Average Home Value in this Area
Purchase History
| Date | Buyer | Sale Price | Title Company |
|---|---|---|---|
| Gonski Chester R | -- | None Available | |
| Gonski Christine A | -- | None Available | |
| Stormy Hill Rt | -- | -- |
Source: Public Records
Tax History
| Year | Tax Paid | Tax Assessment Tax Assessment Total Assessment is a certain percentage of the fair market value that is determined by local assessors to be the total taxable value of land and additions on the property. | Land | Improvement |
|---|---|---|---|---|
| 2025 | $6,875 | $544,800 | $323,700 | $221,100 |
| 2024 | $6,366 | $509,300 | $293,600 | $215,700 |
| 2023 | $6,126 | $477,100 | $265,900 | $211,200 |
| 2022 | $5,815 | $435,600 | $249,700 | $185,900 |
| 2021 | $5,356 | $391,800 | $231,200 | $160,600 |
| 2020 | $5,388 | $392,700 | $231,100 | $161,600 |
| 2019 | $5,086 | $359,400 | $201,000 | $158,400 |
| 2018 | $4,950 | $340,200 | $177,500 | $162,700 |
| 2017 | $4,760 | $322,500 | $166,300 | $156,200 |
| 2016 | $4,963 | $320,400 | $154,000 | $166,400 |
| 2015 | $4,775 | $300,900 | $148,500 | $152,400 |
| 2014 | $4,654 | $289,400 | $145,800 | $143,600 |
Source: Public Records
Map
Nearby Homes
Your Personal Tour Guide
Ask me questions while you tour the home.