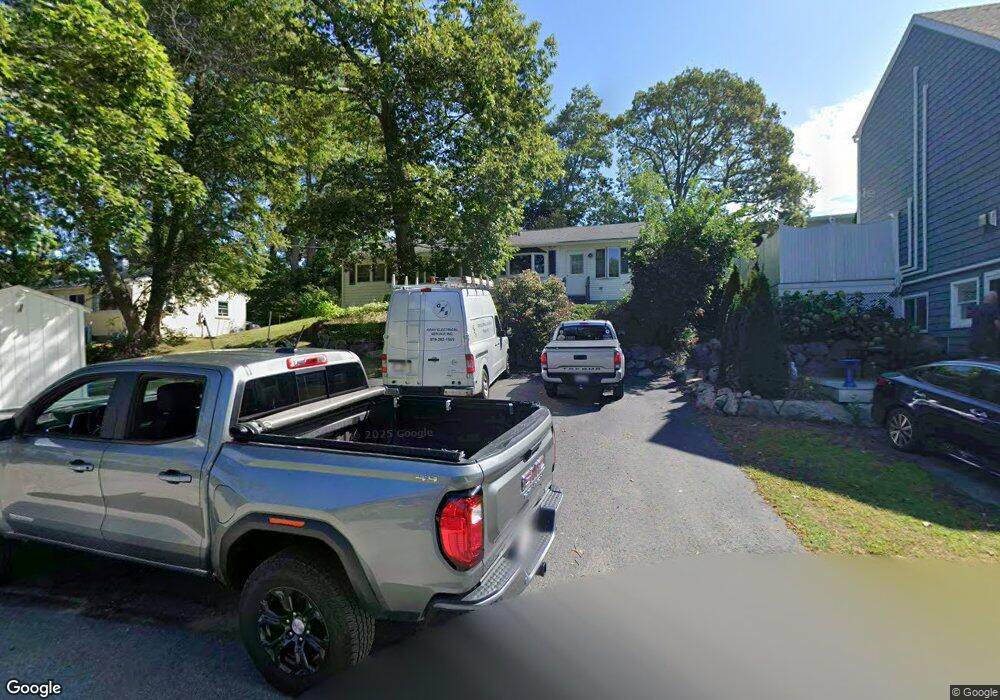
7 Loma Dr Gloucester, MA 01930
East Gloucester NeighborhoodEstimated Value: $598,890 - $724,000
2
Beds
1
Bath
1,259
Sq Ft
$520/Sq Ft
Est. Value
About This Home
This home is located at 7 Loma Dr, Gloucester, MA 01930 and is currently estimated at $654,473, approximately $519 per square foot. 7 Loma Dr is a home located in Essex County with nearby schools including East Gloucester Elementary School, Ralph B O'maley Middle School, and Gloucester High School.
Ownership History
Date
Name
Owned For
Owner Type
Purchase Details
Closed on
May 22, 2009
Sold by
Oneill James F
Bought by
Gray Kevin B
Current Estimated Value
Home Financials for this Owner
Home Financials are based on the most recent Mortgage that was taken out on this home.
Original Mortgage
$200,000
Interest Rate
4.93%
Mortgage Type
Purchase Money Mortgage
Purchase Details
Closed on
Apr 13, 1998
Sold by
Swenson Johann M
Bought by
Oneil James F
Home Financials for this Owner
Home Financials are based on the most recent Mortgage that was taken out on this home.
Original Mortgage
$85,000
Interest Rate
6.98%
Mortgage Type
Purchase Money Mortgage
Purchase Details
Closed on
Sep 18, 1990
Sold by
Anderson Peter S
Bought by
Swenson Charles A
Create a Home Valuation Report for This Property
The Home Valuation Report is an in-depth analysis detailing your home's value as well as a comparison with similar homes in the area
Home Values in the Area
Average Home Value in this Area
Purchase History
| Date | Buyer | Sale Price | Title Company |
|---|---|---|---|
| Gray Kevin B | $255,000 | -- | |
| Oneil James F | $150,000 | -- | |
| Swenson Charles A | $150,000 | -- |
Source: Public Records
Mortgage History
| Date | Status | Borrower | Loan Amount |
|---|---|---|---|
| Open | Swenson Charles A | $189,000 | |
| Closed | Swenson Charles A | $200,000 | |
| Previous Owner | Swenson Charles A | $77,000 | |
| Previous Owner | Swenson Charles A | $85,000 |
Source: Public Records
Tax History
| Year | Tax Paid | Tax Assessment Tax Assessment Total Assessment is a certain percentage of the fair market value that is determined by local assessors to be the total taxable value of land and additions on the property. | Land | Improvement |
|---|---|---|---|---|
| 2025 | $4,646 | $478,000 | $224,900 | $253,100 |
| 2024 | $4,508 | $463,300 | $214,200 | $249,100 |
| 2023 | $4,506 | $425,500 | $191,200 | $234,300 |
| 2022 | $4,225 | $360,200 | $162,600 | $197,600 |
| 2021 | $4,222 | $339,400 | $147,800 | $191,600 |
| 2020 | $3,953 | $320,600 | $147,800 | $172,800 |
| 2019 | $3,906 | $307,800 | $147,800 | $160,000 |
| 2018 | $3,909 | $302,300 | $147,800 | $154,500 |
| 2017 | $3,804 | $288,400 | $140,800 | $147,600 |
| 2016 | $3,623 | $266,200 | $141,300 | $124,900 |
| 2015 | $3,580 | $262,300 | $141,300 | $121,000 |
Source: Public Records
Map
Nearby Homes
- 26 Marina Dr
- 5 Wise Place
- 70 Old Nugent Farm Rd
- 3 Mondello Square
- 36 Eastern Ave
- 32 Witham St Unit B
- 78 Thatcher Rd Unit 6
- 25 Salt Island Rd
- 87 Atlantic Rd Unit 2
- 139A Prospect St
- 15 Mount Vernon St
- 197 E Main St Unit 1
- 19 Trask St Unit 2
- 50 Warner St
- 40 Sargent St
- 113 Pleasant St
- 191 Main St Unit 3
- 191 Main St Unit 2A
- 60 Rocky Neck Ave Unit 202
- 73 Rocky Neck Ave Unit 2
Your Personal Tour Guide
Ask me questions while you tour the home.