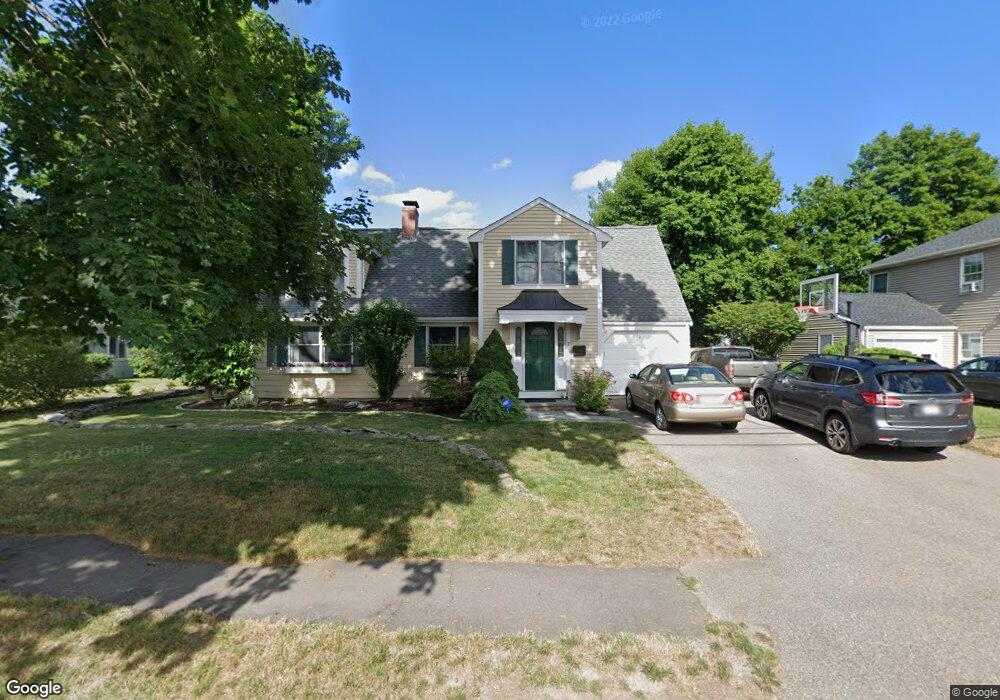
7 Longfellow Rd Natick, MA 01760
Estimated Value: $1,106,747 - $1,222,000
2
Beds
1
Bath
2,497
Sq Ft
$460/Sq Ft
Est. Value
About This Home
This home is located at 7 Longfellow Rd, Natick, MA 01760 and is currently estimated at $1,149,687, approximately $460 per square foot. 7 Longfellow Rd is a home located in Middlesex County with nearby schools including Natick High School, Wilson Middle School, and Bennett-Hemenway (Ben-Hem) Elementary School.
Ownership History
Date
Name
Owned For
Owner Type
Purchase Details
Closed on
Jun 13, 1997
Sold by
Bell Douglas
Bought by
Oconnor Michael and Gerace Lianne
Current Estimated Value
Create a Home Valuation Report for This Property
The Home Valuation Report is an in-depth analysis detailing your home's value as well as a comparison with similar homes in the area
Home Values in the Area
Average Home Value in this Area
Purchase History
| Date | Buyer | Sale Price | Title Company |
|---|---|---|---|
| Oconnor Michael | $159,000 | -- |
Source: Public Records
Mortgage History
| Date | Status | Borrower | Loan Amount |
|---|---|---|---|
| Open | Oconnor Michael | $285,000 | |
| Closed | Oconnor Michael | $301,500 | |
| Closed | Oconnor Michael | $124,000 |
Source: Public Records
Tax History
| Year | Tax Paid | Tax Assessment Tax Assessment Total Assessment is a certain percentage of the fair market value that is determined by local assessors to be the total taxable value of land and additions on the property. | Land | Improvement |
|---|---|---|---|---|
| 2025 | $10,314 | $862,400 | $425,000 | $437,400 |
| 2024 | $9,909 | $808,200 | $400,000 | $408,200 |
| 2023 | $9,812 | $776,300 | $385,000 | $391,300 |
| 2022 | $9,527 | $714,200 | $350,000 | $364,200 |
| 2021 | $9,147 | $672,100 | $330,000 | $342,100 |
| 2020 | $8,587 | $630,900 | $315,000 | $315,900 |
| 2019 | $3,912 | $630,900 | $315,000 | $315,900 |
| 2018 | $7,740 | $593,100 | $300,000 | $293,100 |
| 2017 | $7,322 | $542,800 | $255,000 | $287,800 |
| 2016 | $6,421 | $473,200 | $234,000 | $239,200 |
| 2015 | $6,231 | $450,900 | $234,000 | $216,900 |
Source: Public Records
Map
Nearby Homes
Your Personal Tour Guide
Ask me questions while you tour the home.