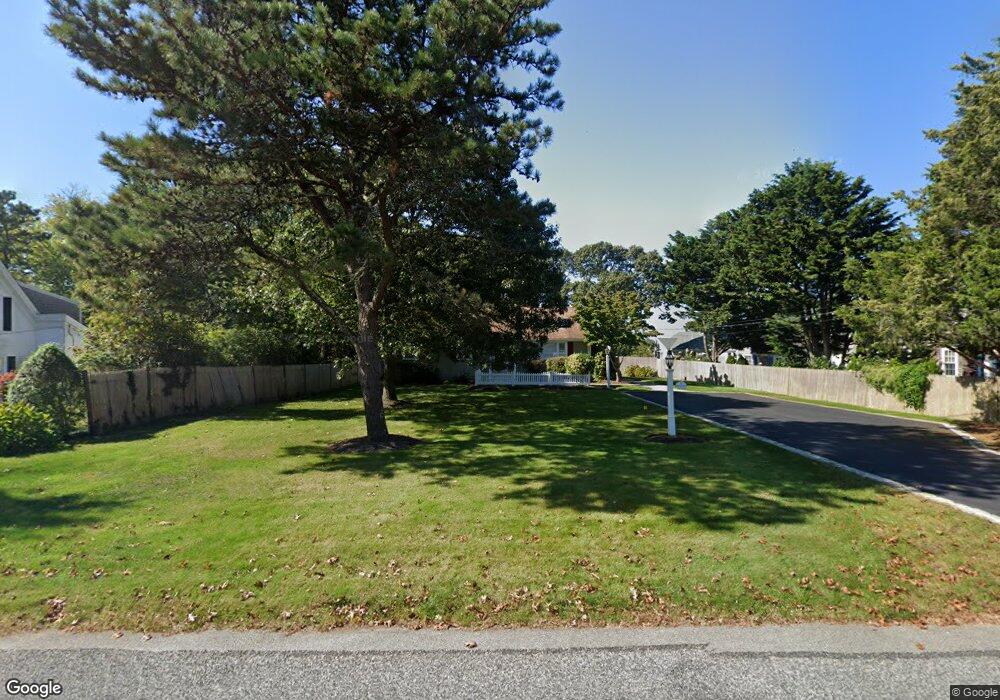
7 Loring Ave West Dennis, MA 02670
West Dennis NeighborhoodEstimated Value: $710,000 - $886,000
3
Beds
2
Baths
1,201
Sq Ft
$670/Sq Ft
Est. Value
About This Home
This home is located at 7 Loring Ave, West Dennis, MA 02670 and is currently estimated at $804,957, approximately $670 per square foot. 7 Loring Ave is a home located in Barnstable County with nearby schools including Dennis-Yarmouth Regional High School and St. Pius X. School.
Ownership History
Date
Name
Owned For
Owner Type
Purchase Details
Closed on
Jan 25, 2023
Sold by
Denorscia Mary C and Denorscia Ralph F
Bought by
Denorscia Irt
Current Estimated Value
Purchase Details
Closed on
Aug 3, 1995
Sold by
Grady Thomas J and Grady Barbara L
Bought by
Denorscia Mary Carol
Create a Home Valuation Report for This Property
The Home Valuation Report is an in-depth analysis detailing your home's value as well as a comparison with similar homes in the area
Home Values in the Area
Average Home Value in this Area
Purchase History
We collect this data history from publicly available records. To have your information removed, we recommend requesting removal directly through your county’s website.
| Date | Buyer | Sale Price | Title Company |
|---|---|---|---|
| Denorscia Irt | -- | None Available | |
| Denorscia Mary Carol | $125,000 | -- |
Source: Public Records
Mortgage History
We collect this data history from publicly available records. To have your information removed, we recommend requesting removal directly through your county’s website.
| Date | Status | Borrower | Loan Amount |
|---|---|---|---|
| Previous Owner | Denorscia Mary Carol | $110,000 |
Source: Public Records
Tax History
| Year | Tax Paid | Tax Assessment Tax Assessment Total Assessment is a certain percentage of the fair market value that is determined by local assessors to be the total taxable value of land and additions on the property. | Land | Improvement |
|---|---|---|---|---|
| 2025 | $2,678 | $618,400 | $185,400 | $433,000 |
| 2024 | $2,561 | $583,300 | $178,300 | $405,000 |
| 2023 | $2,477 | $530,400 | $162,100 | $368,300 |
| 2022 | $2,446 | $436,700 | $160,600 | $276,100 |
| 2021 | $6,150 | $387,800 | $157,400 | $230,400 |
| 2020 | $6,665 | $383,700 | $171,700 | $212,000 |
| 2019 | $6,055 | $329,100 | $140,300 | $188,800 |
| 2018 | $6,083 | $372,200 | $200,400 | $171,800 |
| 2017 | $5,224 | $351,000 | $160,300 | $190,700 |
| 2016 | $2,073 | $317,400 | $180,300 | $137,100 |
| 2015 | $2,031 | $317,400 | $180,300 | $137,100 |
| 2014 | $2,015 | $317,400 | $180,300 | $137,100 |
Source: Public Records
Map
Nearby Homes
- 141 Main St Unit 23
- 43 Pond St Unit 11
- 68 Loring Ave
- 45 Seth Ln
- 308 Old Main St
- 127 Uncle Barneys Rd
- 231 Mill Ln
- 24 Doric Ave
- 8 Buckley Rd
- 29 Bass River Rd
- 48 Sea Gull Ln
- 177 Fisk St
- 177 Fisk St
- 111 School St Unit 2
- 371 Main St Unit 14
- 371 Main St Unit 23
- 371 Main St Unit 1
- 27 Porter Ln
- 3 Wendy Way
- 34 S Main St
Your Personal Tour Guide
Ask me questions while you tour the home.