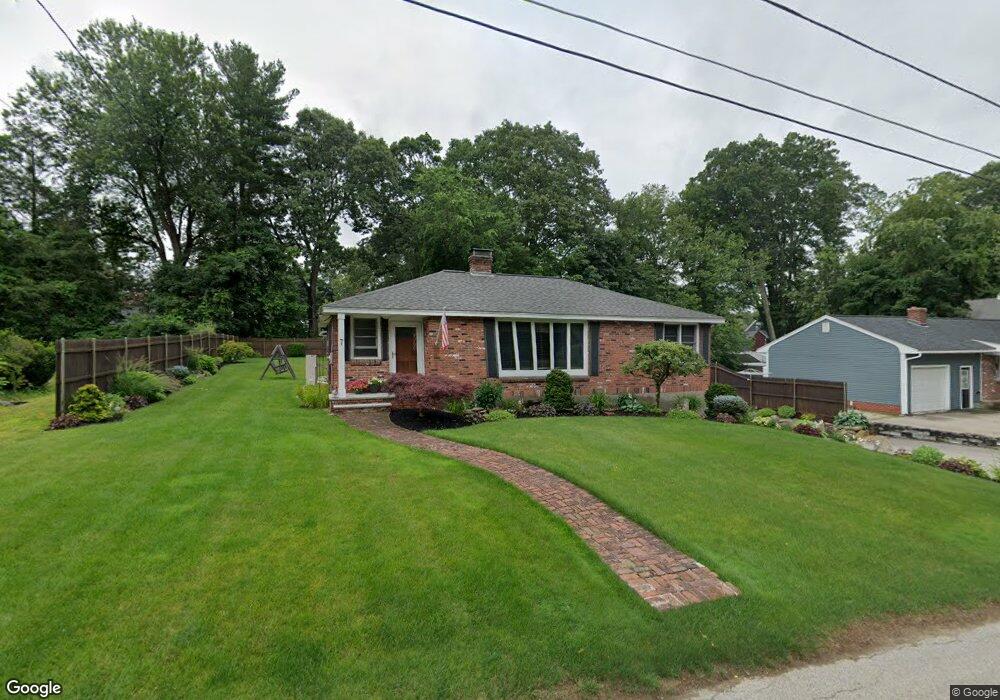
7 Loring St Auburn, MA 01501
Downtown Auburn NeighborhoodEstimated Value: $439,000 - $543,000
3
Beds
2
Baths
1,102
Sq Ft
$441/Sq Ft
Est. Value
About This Home
This home is located at 7 Loring St, Auburn, MA 01501 and is currently estimated at $486,013, approximately $441 per square foot. 7 Loring St is a home located in Worcester County with nearby schools including Auburn Senior High School and Shrewsbury Montessori School - Auburn Campus.
Ownership History
Date
Name
Owned For
Owner Type
Purchase Details
Closed on
Dec 31, 2020
Sold by
Cote Scott C and Manchester Susan J
Bought by
Manchester Susan J and Manchester Carl F
Current Estimated Value
Purchase Details
Closed on
Nov 14, 2019
Sold by
Manchester Susan J and Manchester Carl F
Bought by
Cote Scott C
Purchase Details
Closed on
May 11, 1990
Sold by
Crawford Carroll C
Bought by
Manchester Susan M
Home Financials for this Owner
Home Financials are based on the most recent Mortgage that was taken out on this home.
Original Mortgage
$123,900
Interest Rate
10.15%
Mortgage Type
Purchase Money Mortgage
Create a Home Valuation Report for This Property
The Home Valuation Report is an in-depth analysis detailing your home's value as well as a comparison with similar homes in the area
Home Values in the Area
Average Home Value in this Area
Purchase History
| Date | Buyer | Sale Price | Title Company |
|---|---|---|---|
| Manchester Susan J | -- | None Available | |
| Cote Scott C | -- | None Available | |
| Manchester Susan M | $137,000 | -- |
Source: Public Records
Mortgage History
| Date | Status | Borrower | Loan Amount |
|---|---|---|---|
| Previous Owner | Manchester Susan M | $137,025 | |
| Previous Owner | Manchester Susan M | $100,000 | |
| Previous Owner | Manchester Susan M | $123,900 | |
| Previous Owner | Manchester Susan M | $40,000 |
Source: Public Records
Tax History
| Year | Tax Paid | Tax Assessment Tax Assessment Total Assessment is a certain percentage of the fair market value that is determined by local assessors to be the total taxable value of land and additions on the property. | Land | Improvement |
|---|---|---|---|---|
| 2025 | $58 | $408,600 | $138,000 | $270,600 |
| 2024 | $5,823 | $390,000 | $131,500 | $258,500 |
| 2023 | $5,612 | $353,400 | $119,600 | $233,800 |
| 2022 | $5,261 | $312,800 | $119,600 | $193,200 |
| 2021 | $5,014 | $276,400 | $105,500 | $170,900 |
| 2020 | $4,970 | $276,400 | $105,500 | $170,900 |
| 2019 | $4,614 | $250,500 | $104,500 | $146,000 |
| 2018 | $4,354 | $236,100 | $97,700 | $138,400 |
| 2017 | $4,163 | $227,000 | $88,600 | $138,400 |
| 2016 | $3,931 | $217,300 | $92,700 | $124,600 |
| 2015 | $3,714 | $215,200 | $92,700 | $122,500 |
| 2014 | $3,515 | $203,300 | $88,300 | $115,000 |
Source: Public Records
Map
Nearby Homes
- 8 South Terrace
- 6 George St
- 61 School St
- 751 Washington St Unit 43A
- 137 South St
- 36 Central St
- 166 Leicester St
- 634 Oxford St S
- 35 Waterman Rd
- 328 Oxford St N
- 33 Eastford Rd
- 49 Prospect St
- 31 Walsh Ave
- 31-33 Walsh Ave
- 33 Walsh Ave
- 40 Bryn Mawr Ave
- 808 Washington St
- 0 Athens St
- 4 Athens St
- 19-20 Williams St
Your Personal Tour Guide
Ask me questions while you tour the home.