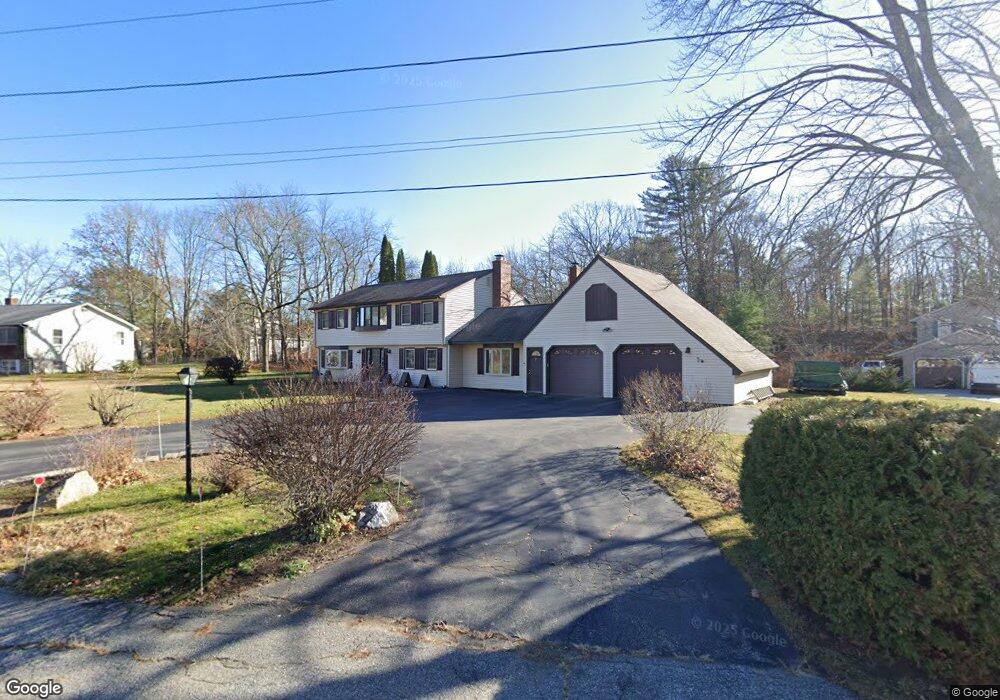
7 Lunt St Biddeford, ME 04005
Estimated Value: $535,356 - $668,000
4
Beds
2
Baths
2,272
Sq Ft
$259/Sq Ft
Est. Value
About This Home
This home is located at 7 Lunt St, Biddeford, ME 04005 and is currently estimated at $588,589, approximately $259 per square foot. 7 Lunt St is a home located in York County with nearby schools including John F Kennedy Memorial School, Biddeford Primary School, and Biddeford Intermediate School.
Ownership History
Date
Name
Owned For
Owner Type
Purchase Details
Closed on
Nov 17, 2006
Sold by
Paige Hoa T and Paige Robert B
Bought by
Thy Mean
Current Estimated Value
Home Financials for this Owner
Home Financials are based on the most recent Mortgage that was taken out on this home.
Original Mortgage
$208,000
Outstanding Balance
$120,637
Interest Rate
6.33%
Mortgage Type
Purchase Money Mortgage
Estimated Equity
$467,952
Create a Home Valuation Report for This Property
The Home Valuation Report is an in-depth analysis detailing your home's value as well as a comparison with similar homes in the area
Home Values in the Area
Average Home Value in this Area
Purchase History
| Date | Buyer | Sale Price | Title Company |
|---|---|---|---|
| Thy Mean | -- | -- |
Source: Public Records
Mortgage History
| Date | Status | Borrower | Loan Amount |
|---|---|---|---|
| Open | Thy Mean | $208,000 |
Source: Public Records
Tax History
| Year | Tax Paid | Tax Assessment Tax Assessment Total Assessment is a certain percentage of the fair market value that is determined by local assessors to be the total taxable value of land and additions on the property. | Land | Improvement |
|---|---|---|---|---|
| 2025 | $6,184 | $413,900 | $167,500 | $246,400 |
| 2024 | $5,967 | $419,600 | $167,500 | $252,100 |
| 2023 | $5,464 | $416,500 | $164,400 | $252,100 |
| 2022 | $5,427 | $330,700 | $92,500 | $238,200 |
| 2021 | $5,072 | $278,200 | $78,400 | $199,800 |
| 2020 | $5,093 | $254,000 | $71,200 | $182,800 |
| 2019 | $5,075 | $254,000 | $71,200 | $182,800 |
| 2018 | $5,004 | $254,000 | $71,200 | $182,800 |
| 2017 | $4,969 | $247,600 | $71,200 | $176,400 |
| 2016 | $4,917 | $247,600 | $71,200 | $176,400 |
| 2015 | $4,626 | $247,600 | $71,200 | $176,400 |
| 2014 | $4,702 | $247,600 | $71,200 | $176,400 |
| 2013 | -- | $228,500 | $63,200 | $165,300 |
Source: Public Records
Map
Nearby Homes
- 2 Banks Ln
- 5 Horrigan Ct
- 66 W Cutts St
- 70 Mason St
- 11 Chadwick Place
- 4 Kossuth St
- 7 Brook St
- 12 Kossuth St
- 242 Lincoln St
- 19 Lessard Ave
- 66 Graham St
- 88 May St Unit 101
- 88 May St Unit 102
- 674 South St
- 109 Alfred St
- 120 Lincoln St
- 20 Upper Falls Rd Unit 403
- 20 Upper Falls Rd Unit 406
- 20 Upper Falls Rd Unit 503
- 20 Upper Falls Rd Unit 501
Your Personal Tour Guide
Ask me questions while you tour the home.