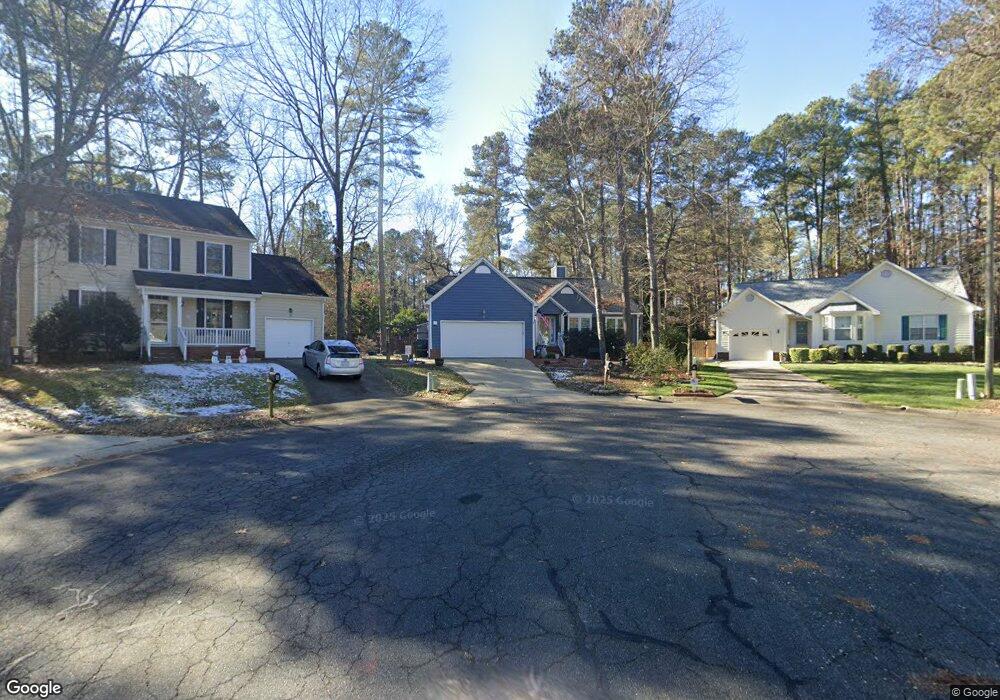
7 Madeira Ct Durham, NC 27713
Woodcroft NeighborhoodEstimated Value: $458,947 - $487,000
3
Beds
2
Baths
1,540
Sq Ft
$307/Sq Ft
Est. Value
About This Home
This home is located at 7 Madeira Ct, Durham, NC 27713 and is currently estimated at $472,237, approximately $306 per square foot. 7 Madeira Ct is a home located in Durham County with nearby schools including Pearsontown Elementary School, Lowe's Grove Middle, and Hillside High School.
Ownership History
Date
Name
Owned For
Owner Type
Purchase Details
Closed on
Aug 8, 2019
Sold by
Efinger Patricia J
Bought by
Montgomery Susan and Kelce Karen A
Current Estimated Value
Purchase Details
Closed on
Nov 30, 2018
Sold by
Campbell Duane J
Bought by
Efinger Patricia J
Home Financials for this Owner
Home Financials are based on the most recent Mortgage that was taken out on this home.
Original Mortgage
$275,405
Outstanding Balance
$240,496
Interest Rate
4.37%
Mortgage Type
Adjustable Rate Mortgage/ARM
Estimated Equity
$231,741
Purchase Details
Closed on
Jul 6, 2011
Sold by
Presson Gerda and Presson Gene M
Bought by
Campbell Duane J and Campbell Katharine
Purchase Details
Closed on
Nov 15, 2002
Sold by
Reece Jeffrey Donald and Reece Wendy Marie
Bought by
Barber Gerda
Home Financials for this Owner
Home Financials are based on the most recent Mortgage that was taken out on this home.
Original Mortgage
$120,000
Interest Rate
5.5%
Create a Home Valuation Report for This Property
The Home Valuation Report is an in-depth analysis detailing your home's value as well as a comparison with similar homes in the area
Home Values in the Area
Average Home Value in this Area
Purchase History
| Date | Buyer | Sale Price | Title Company |
|---|---|---|---|
| Montgomery Susan | -- | None Available | |
| Efinger Patricia J | $290,000 | None Available | |
| Campbell Duane J | $190,000 | None Available | |
| Barber Gerda | $162,000 | -- |
Source: Public Records
Mortgage History
| Date | Status | Borrower | Loan Amount |
|---|---|---|---|
| Open | Efinger Patricia J | $275,405 | |
| Previous Owner | Barber Gerda | $120,000 |
Source: Public Records
Tax History
| Year | Tax Paid | Tax Assessment Tax Assessment Total Assessment is a certain percentage of the fair market value that is determined by local assessors to be the total taxable value of land and additions on the property. | Land | Improvement |
|---|---|---|---|---|
| 2025 | $4,851 | $489,327 | $158,600 | $330,727 |
| 2024 | $3,880 | $278,188 | $45,862 | $232,326 |
| 2023 | $3,644 | $278,188 | $45,862 | $232,326 |
| 2022 | $3,561 | $278,188 | $45,862 | $232,326 |
| 2021 | $3,544 | $278,188 | $45,862 | $232,326 |
| 2020 | $3,460 | $278,188 | $45,862 | $232,326 |
| 2019 | $3,460 | $278,188 | $45,862 | $232,326 |
| 2018 | $2,955 | $217,821 | $45,862 | $171,959 |
| 2017 | $2,933 | $217,821 | $45,862 | $171,959 |
| 2016 | $2,834 | $217,821 | $45,862 | $171,959 |
| 2015 | $2,840 | $205,190 | $39,115 | $166,075 |
| 2014 | -- | $205,190 | $39,115 | $166,075 |
Source: Public Records
Map
Nearby Homes
- 63 Lake Village Dr
- 8 Drummond Ct
- 6004 Tahoe Dr
- 514 Auburn Square Dr
- 6502 Barbee Rd
- 503 Forge Rd
- 5624 Barbee Rd
- 1058 Flagler St
- 1062 Flagler St
- 1001 Pebble Creek Crossing Unit 11
- 1076 Flagler St
- 5511 Tahoe Dr
- 12 Byerly Ct
- 1 Chownings St
- 1129 Pebble Creek Crossing
- 6500 Amber Springs Dr
- 515 Wellingham Dr
- 500 W Woodcroft Pkwy Unit 9b
- 200 W Woodcroft Pkwy Unit 60c
- 5708 Catskill Ct
- 8 Madeira Ct
- 5 Madeira Ct
- 6 Madeira Ct
- 3 Madeira Ct
- 3 Madeira Ct Unit GH 23
- 4 Madeira Ct
- 12 Casabelle Ct
- 1 Madeira Ct
- 6 Casabelle Ct
- 5927 Woodlake Dr
- 5923 Woodlake Dr
- 4 Casabelle Ct
- 14 Casabelle Ct
- 9 Casabelle Ct
- 7 Casabelle Ct
- 5 Casabelle Ct
- 11 Casabelle Ct
- 61 Lake Village Dr
- 15 Casabelle Ct
- 13 Casabelle Ct