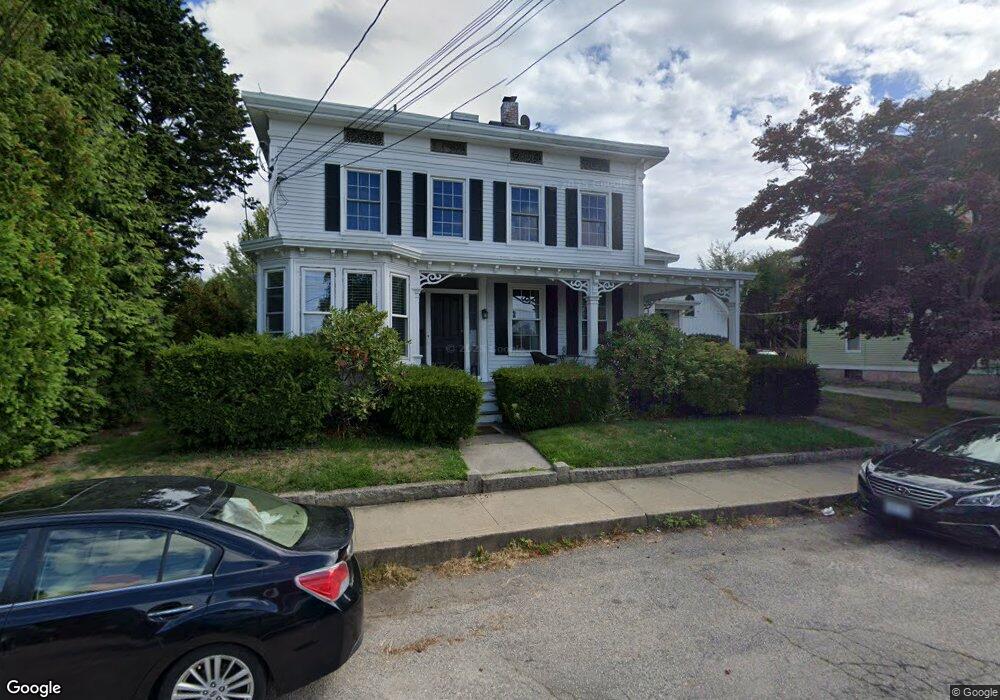
7 Maple Ave Westerly, RI 02891
Estimated Value: $642,000 - $866,000
5
Beds
3
Baths
5,830
Sq Ft
$132/Sq Ft
Est. Value
About This Home
This home is located at 7 Maple Ave, Westerly, RI 02891 and is currently estimated at $770,772, approximately $132 per square foot. 7 Maple Ave is a home located in Washington County with nearby schools including Westerly High School and St. Michael School.
Ownership History
Date
Name
Owned For
Owner Type
Purchase Details
Closed on
Nov 3, 2020
Sold by
Delbarone Matthew J and Delbarone Vanessa A
Bought by
Delbarone Vanessa A
Current Estimated Value
Purchase Details
Closed on
Oct 29, 2010
Sold by
Evans Robin M
Bought by
Delbarone Matthew J
Purchase Details
Closed on
Dec 4, 2009
Sold by
Evans Robin M
Bought by
Evans Robin M
Purchase Details
Closed on
Aug 25, 1995
Sold by
Fink James R and Fink Patricia
Bought by
Chisnell Norma V
Home Financials for this Owner
Home Financials are based on the most recent Mortgage that was taken out on this home.
Original Mortgage
$131,900
Interest Rate
7.32%
Create a Home Valuation Report for This Property
The Home Valuation Report is an in-depth analysis detailing your home's value as well as a comparison with similar homes in the area
Home Values in the Area
Average Home Value in this Area
Purchase History
| Date | Buyer | Sale Price | Title Company |
|---|---|---|---|
| Delbarone Vanessa A | -- | None Available | |
| Delbarone Matthew J | $349,000 | -- | |
| Evans Robin M | -- | -- | |
| Chisnell Norma V | $165,000 | -- |
Source: Public Records
Mortgage History
| Date | Status | Borrower | Loan Amount |
|---|---|---|---|
| Previous Owner | Chisnell Norma V | $354,765 | |
| Previous Owner | Chisnell Norma V | $131,900 |
Source: Public Records
Tax History
| Year | Tax Paid | Tax Assessment Tax Assessment Total Assessment is a certain percentage of the fair market value that is determined by local assessors to be the total taxable value of land and additions on the property. | Land | Improvement |
|---|---|---|---|---|
| 2025 | $4,871 | $626,100 | $160,500 | $465,600 |
| 2024 | $4,764 | $455,900 | $115,000 | $340,900 |
| 2023 | $4,586 | $451,400 | $115,000 | $336,400 |
| 2022 | $4,559 | $451,400 | $115,000 | $336,400 |
| 2021 | $4,662 | $386,600 | $100,100 | $286,500 |
| 2020 | $4,581 | $386,600 | $100,100 | $286,500 |
| 2019 | $4,539 | $386,600 | $100,100 | $286,500 |
| 2018 | $4,282 | $346,700 | $100,100 | $246,600 |
| 2017 | $4,160 | $346,700 | $100,100 | $246,600 |
| 2016 | $4,160 | $346,700 | $100,100 | $246,600 |
| 2015 | $3,874 | $345,000 | $107,100 | $237,900 |
| 2014 | $3,453 | $345,000 | $107,100 | $237,900 |
Source: Public Records
Map
Nearby Homes
- 25 School St Unit 2
- 77 Mechanic St
- 2 Gravity Ct
- 24 George St
- 38 Prospect St
- 65 Mechanic St
- 12 Canal St Unit 205
- 15 Moss St
- 28 Spruce St
- 141 W Broad St
- 13 Palmer St
- 21 Linden St
- 52 Spruce St
- 55 Pleasant St
- 40 Pleasant St
- 60 Margin St Unit 102
- 140 High St Unit 307
- 145 High St Unit D
- 1 Jovere Dr
- 2 Pawcatuck Ave
Your Personal Tour Guide
Ask me questions while you tour the home.