
Seller's Agent in 2025
Mary Brannelly
Barrett Sotheby's International Realty
(978) 263-1166
71 Total Sales

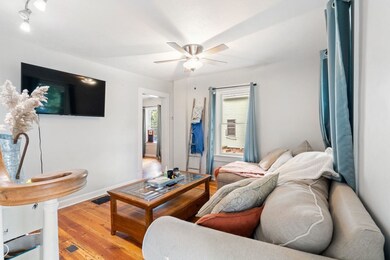
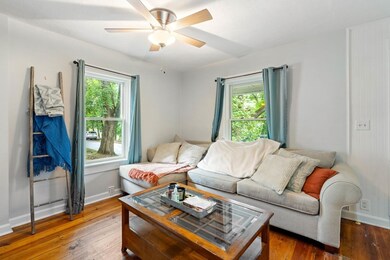
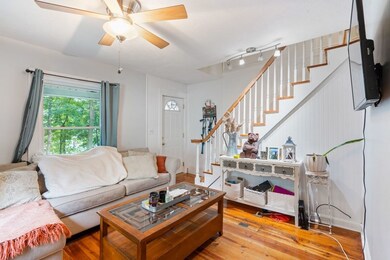
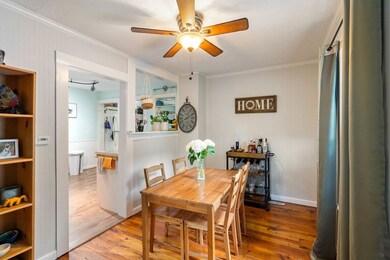
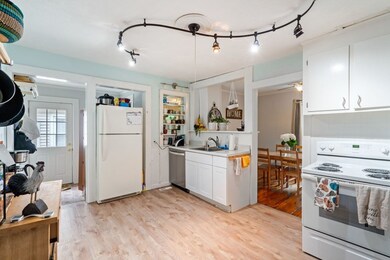
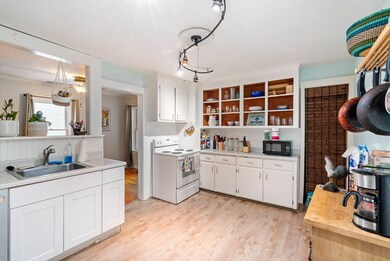
Outstanding three bedroom condo that feels like a single family home. This two-level townhouse features spacious kitchen, living room, dining room, front porch, outdoor space, and easy access to Downtown Maynard. The Assabet River Rail Trail is across the street from your front door! Two off-street parking spaces are included with this unit. Showings begin at open houses August 14th and 15th from 11:00am - 1:00pm.
Last Agent to Sell the Property
Gibson Sotheby's International Realty Listed on: 08/12/2021
Home Type
Condominium
Est. Annual Taxes
$5,800
Year Built
1920
Lot Details
0
HOA Fees
$125 per month
| Date | Type | Sale Price | Title Company |
|---|---|---|---|
| Condominium Deed | $405,000 | None Available | |
| Condominium Deed | $405,000 | None Available | |
| Condominium Deed | $295,000 | None Available | |
| Condominium Deed | $295,000 | None Available | |
| Condominium Deed | $240,000 | -- | |
| Not Resolvable | $240,000 | -- | |
| Deed | -- | -- | |
| Deed | -- | -- |
| Date | Status | Loan Amount | Loan Type |
|---|---|---|---|
| Open | $384,750 | Purchase Money Mortgage | |
| Closed | $384,750 | Purchase Money Mortgage | |
| Previous Owner | $280,250 | Purchase Money Mortgage | |
| Previous Owner | $216,000 | New Conventional | |
| Previous Owner | $171,000 | Purchase Money Mortgage |
| Date | Event | Price | Change | Sq Ft Price |
|---|---|---|---|---|
| 06/24/2025 06/24/25 | Sold | $405,000 | +2.7% | $422 / Sq Ft |
| 05/11/2025 05/11/25 | Pending | -- | -- | -- |
| 05/08/2025 05/08/25 | For Sale | $394,500 | +33.7% | $411 / Sq Ft |
| 10/04/2021 10/04/21 | Sold | $295,000 | -6.3% | $284 / Sq Ft |
| 08/17/2021 08/17/21 | Pending | -- | -- | -- |
| 08/12/2021 08/12/21 | For Sale | $315,000 | +31.3% | $303 / Sq Ft |
| 09/27/2019 09/27/19 | Sold | $240,000 | -3.6% | $231 / Sq Ft |
| 08/23/2019 08/23/19 | Pending | -- | -- | -- |
| 07/31/2019 07/31/19 | Price Changed | $248,900 | -0.4% | $239 / Sq Ft |
| 06/11/2019 06/11/19 | For Sale | $249,900 | +4.1% | $240 / Sq Ft |
| 07/31/2018 07/31/18 | Sold | $240,000 | +9.6% | $231 / Sq Ft |
| 06/26/2018 06/26/18 | Pending | -- | -- | -- |
| 06/23/2018 06/23/18 | Price Changed | $219,000 | -4.4% | $211 / Sq Ft |
| 05/17/2018 05/17/18 | For Sale | $229,000 | -- | $220 / Sq Ft |
| Year | Tax Paid | Tax Assessment Tax Assessment Total Assessment is a certain percentage of the fair market value that is determined by local assessors to be the total taxable value of land and additions on the property. | Land | Improvement |
|---|---|---|---|---|
| 2025 | $5,800 | $325,300 | $0 | $325,300 |
| 2024 | $5,210 | $291,400 | $0 | $291,400 |
| 2023 | $5,268 | $277,700 | $0 | $277,700 |
| 2022 | $4,654 | $226,800 | $0 | $226,800 |
| 2021 | $4,467 | $221,700 | $0 | $221,700 |
| 2020 | $4,526 | $219,300 | $0 | $219,300 |
| 2019 | $2,592 | $123,200 | $0 | $123,200 |
| 2018 | $2,644 | $116,800 | $0 | $116,800 |
| 2017 | $2,588 | $117,600 | $0 | $117,600 |
| 2016 | $2,372 | $111,600 | $0 | $111,600 |
| 2015 | $2,490 | $111,600 | $0 | $111,600 |
| 2014 | $2,289 | $102,700 | $0 | $102,700 |
Seller's Agent in 2025
Mary Brannelly
Barrett Sotheby's International Realty
(978) 263-1166
71 Total Sales
N
Buyer's Agent in 2025
Nate Daglio
Charlesgate Realty Group, llc
Seller's Agent in 2021
Jesse Gustafson
Gibson Sotheby's International Realty
(617) 642-4787
69 Total Sales
Seller's Agent in 2019
Lauren Tetreault
Coldwell Banker Realty - Concord
(978) 273-2005
205 Total Sales
Seller's Agent in 2018
Steven Smith
Keller Williams Realty Boston Northwest
(763) 323-7181
82 Total Sales
Buyer's Agent in 2018
Patricia Sands
Coldwell Banker Realty - Concord
(617) 413-2840
105 Total Sales
Source: MLS Property Information Network (MLS PIN)
MLS Number: 72880177
APN: MAYN-000009-000000-000340-C000000
Disclaimer: Certain information contained herein is derived from information provided by parties other than Homes.com. All information provided is deemed reliable, but is not guaranteed to be accurate and should be independently verified.
![]() The property listing data and information, or the Images, set forth herein were provided to MLS Property Information Network, Inc. from third party sources, including sellers, lessors and public records, and were compiled by MLS Property Information Network, Inc. The property listing data and information, and the Images, are for the personal, non-commercial use of consumers having a good faith interest in purchasing or leasing listed properties of the type displayed to them and may not be used for any purpose other than to identify prospective properties which such consumers may have a good faith interest in purchasing or leasing. MLS Property Information Network, Inc. and its subscribers disclaim any and all representations and warranties as to the accuracy of the property listing data and information, or as to the accuracy of any of the Images, set forth herein.
The property listing data and information, or the Images, set forth herein were provided to MLS Property Information Network, Inc. from third party sources, including sellers, lessors and public records, and were compiled by MLS Property Information Network, Inc. The property listing data and information, and the Images, are for the personal, non-commercial use of consumers having a good faith interest in purchasing or leasing listed properties of the type displayed to them and may not be used for any purpose other than to identify prospective properties which such consumers may have a good faith interest in purchasing or leasing. MLS Property Information Network, Inc. and its subscribers disclaim any and all representations and warranties as to the accuracy of the property listing data and information, or as to the accuracy of any of the Images, set forth herein.