7 Maple St Greenville, SC 29609
North Greenville NeighborhoodEstimated Value: $116,000 - $194,000
2
Beds
1
Bath
736
Sq Ft
$219/Sq Ft
Est. Value
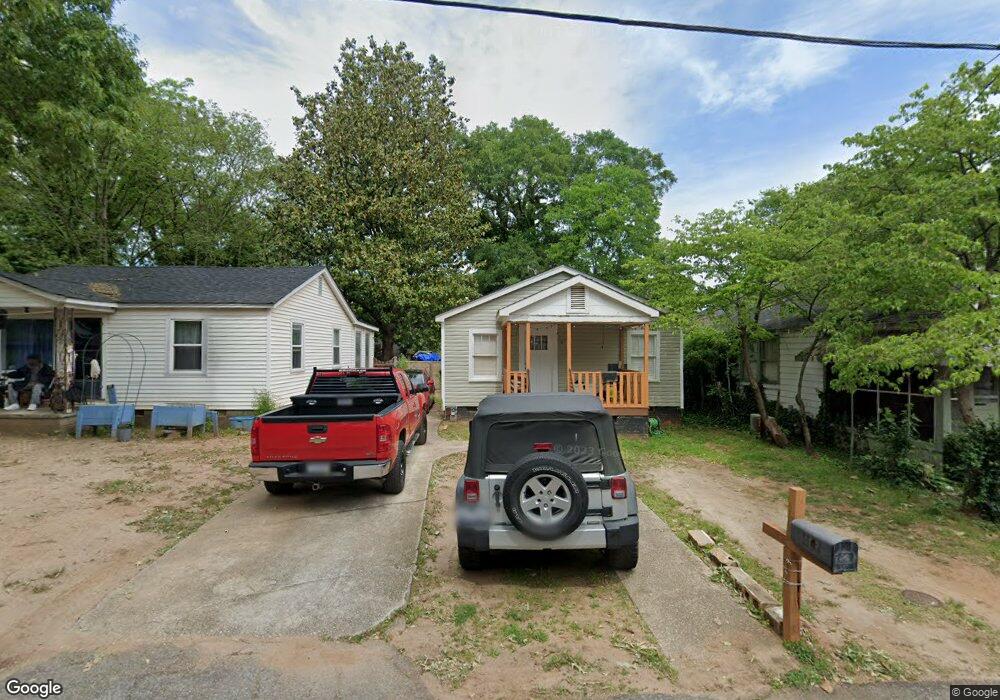
About This Home
This home is located at 7 Maple St, Greenville, SC 29609 and is currently estimated at $161,314, approximately $219 per square foot. 7 Maple St is a home located in Greenville County with nearby schools including Summit Drive Elementary School, League Academy, and Berea High School.
Ownership History
Date
Name
Owned For
Owner Type
Purchase Details
Closed on
Jan 25, 2017
Sold by
Miralda Anadilia
Bought by
Uribe Alfredo Lozano
Current Estimated Value
Purchase Details
Closed on
Feb 13, 2015
Sold by
Redrock Capital Llc
Bought by
Miralda Anadilia
Purchase Details
Closed on
Dec 18, 2014
Sold by
Arteaga Fulgencio
Bought by
Redrock Capital Fund Ii
Purchase Details
Closed on
Feb 15, 2002
Sold by
Coda Development
Bought by
Arteaga Fulgencio
Purchase Details
Closed on
Oct 17, 2001
Sold by
Anderson Robert F Trustee In Bankruptcy
Bought by
Grand South Bank
Create a Home Valuation Report for This Property
The Home Valuation Report is an in-depth analysis detailing your home's value as well as a comparison with similar homes in the area
Home Values in the Area
Average Home Value in this Area
Purchase History
| Date | Buyer | Sale Price | Title Company |
|---|---|---|---|
| Uribe Alfredo Lozano | $6,500 | None Available | |
| Miralda Anadilia | $6,000 | None Available | |
| Miralda Anadilia | $6,000 | -- | |
| Redrock Capital Fund Ii | $1,375 | -- | |
| Arteaga Fulgencio | $29,000 | -- | |
| Grand South Bank | $1,000 | -- |
Source: Public Records
Tax History
| Year | Tax Paid | Tax Assessment Tax Assessment Total Assessment is a certain percentage of the fair market value that is determined by local assessors to be the total taxable value of land and additions on the property. | Land | Improvement |
|---|---|---|---|---|
| 2025 | $1,504 | $3,600 | $810 | $2,790 |
| 2024 | $1,504 | $3,120 | $360 | $2,760 |
| 2023 | $1,450 | $3,120 | $360 | $2,760 |
| 2022 | $1,400 | $3,120 | $360 | $2,760 |
| 2021 | $1,506 | $3,120 | $360 | $2,760 |
| 2020 | $1,515 | $2,960 | $360 | $2,600 |
| 2019 | $1,493 | $2,960 | $360 | $2,600 |
| 2018 | $1,367 | $2,960 | $360 | $2,600 |
| 2017 | $1,061 | $2,160 | $360 | $1,800 |
| 2016 | $1,003 | $35,980 | $6,000 | $29,980 |
| 2015 | $1,003 | $35,980 | $6,000 | $29,980 |
| 2014 | $1,126 | $32,938 | $4,762 | $28,176 |
Source: Public Records
Map
Nearby Homes
- 407 Old Paris Mountain Rd
- 34 Happy Ave
- 0 Foster St Unit Foster Street
- 8 Cotton St
- 22 Cotton St
- 224 Orange St
- 726 Rutherford Rd
- 210 W Mountainview Ave
- 46 W Hillcrest Dr
- 1726 N Main St
- 221 Buist Ave
- 308 Worley Rd
- 111 Hammett St
- 15A Oakhurst Ave
- 105 Burgess Ave
- 4 E Montclair Ave
- 204 Ashley Ave
- 12 Hudson St
- 4 Claret Dr
- 26 Windsor Dr
Your Personal Tour Guide
Ask me questions while you tour the home.