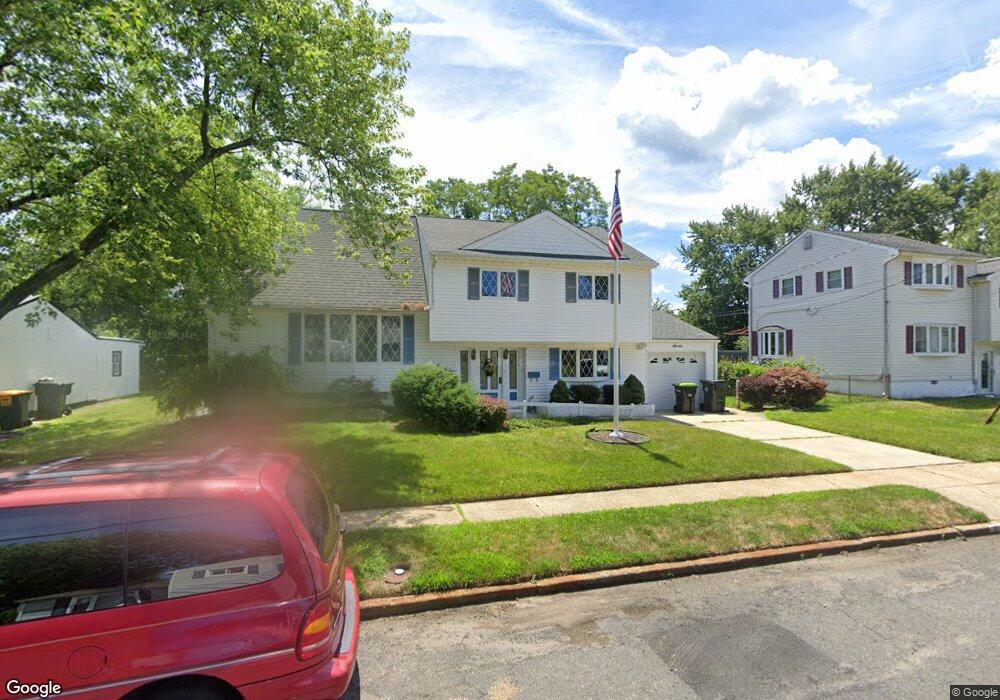
7 Marsand Dr Hazlet, NJ 07730
Estimated Value: $575,000 - $637,458
3
Beds
2
Baths
1,942
Sq Ft
$314/Sq Ft
Est. Value
About This Home
This home is located at 7 Marsand Dr, Hazlet, NJ 07730 and is currently estimated at $609,615, approximately $313 per square foot. 7 Marsand Dr is a home located in Monmouth County with nearby schools including Raritan High School and Baytul-Iman Academy.
Ownership History
Date
Name
Owned For
Owner Type
Purchase Details
Closed on
Nov 12, 2024
Sold by
Roche Cathleen A
Bought by
Nieves Cristino
Current Estimated Value
Home Financials for this Owner
Home Financials are based on the most recent Mortgage that was taken out on this home.
Original Mortgage
$196,377
Outstanding Balance
$194,422
Interest Rate
6.12%
Mortgage Type
FHA
Estimated Equity
$415,193
Purchase Details
Closed on
Dec 30, 2016
Sold by
Wyatt Patricia A
Bought by
Roche Cathleen A
Home Financials for this Owner
Home Financials are based on the most recent Mortgage that was taken out on this home.
Interest Rate
4.32%
Purchase Details
Closed on
Jun 14, 2016
Sold by
Wyatt Patricia A and Wyatt Robert G
Bought by
Roche Catherine A
Home Financials for this Owner
Home Financials are based on the most recent Mortgage that was taken out on this home.
Interest Rate
3.6%
Purchase Details
Closed on
Jul 27, 1959
Bought by
Wyatt Robert G and Wyatt Patricia A
Create a Home Valuation Report for This Property
The Home Valuation Report is an in-depth analysis detailing your home's value as well as a comparison with similar homes in the area
Home Values in the Area
Average Home Value in this Area
Purchase History
| Date | Buyer | Sale Price | Title Company |
|---|---|---|---|
| Nieves Cristino | $200,000 | Clear To Close Title | |
| Nieves Cristino | $200,000 | Clear To Close Title | |
| Roche Cathleen A | -- | -- | |
| Roche Catherine A | -- | -- | |
| Wyatt Robert G | -- | -- |
Source: Public Records
Mortgage History
| Date | Status | Borrower | Loan Amount |
|---|---|---|---|
| Open | Nieves Cristino | $196,377 | |
| Closed | Nieves Cristino | $196,377 | |
| Previous Owner | Roche Catherine A | -- | |
| Previous Owner | Roche Catherine A | -- |
Source: Public Records
Tax History Compared to Growth
Tax History
| Year | Tax Paid | Tax Assessment Tax Assessment Total Assessment is a certain percentage of the fair market value that is determined by local assessors to be the total taxable value of land and additions on the property. | Land | Improvement |
|---|---|---|---|---|
| 2025 | $10,519 | $548,000 | $315,700 | $232,300 |
| 2024 | $10,899 | $500,200 | $268,900 | $231,300 |
| 2023 | $10,899 | $510,000 | $280,800 | $229,200 |
| 2022 | $9,864 | $435,600 | $233,800 | $201,800 |
| 2021 | $9,864 | $394,300 | $214,800 | $179,500 |
| 2020 | $9,948 | $385,300 | $209,800 | $175,500 |
| 2019 | $9,687 | $369,300 | $194,800 | $174,500 |
| 2018 | $9,411 | $355,800 | $189,800 | $166,000 |
| 2017 | $8,906 | $336,700 | $175,800 | $160,900 |
| 2016 | $8,767 | $332,700 | $175,800 | $156,900 |
| 2015 | $8,254 | $323,600 | $170,800 | $152,800 |
| 2014 | $7,612 | $280,600 | $134,800 | $145,800 |
Source: Public Records
Map
Nearby Homes
- 6 Ridge Dr
- 22 Weller Place Unit 22
- 8 Leocadia Ct
- 27 Gibson Dr
- 9 Borick Ave
- 64 Agostina Dr Unit 64
- 58 Agostina Dr Unit 250
- 53 Agostina Dr
- 82 Agostina Dr
- 64 Hawthorne Ave
- 1 Oxford Rd Unit 34A
- 3 Lisa Dr
- 8 Stagecoach Dr Unit 13
- 4 Pine Tree Terrace
- 3 John St Unit 118
- 725 Palmer Ave
- 901 Palmer Ave
- 17 Avenue D
- 32 Bristel Rd Unit 212
- 846 Palmer Ave