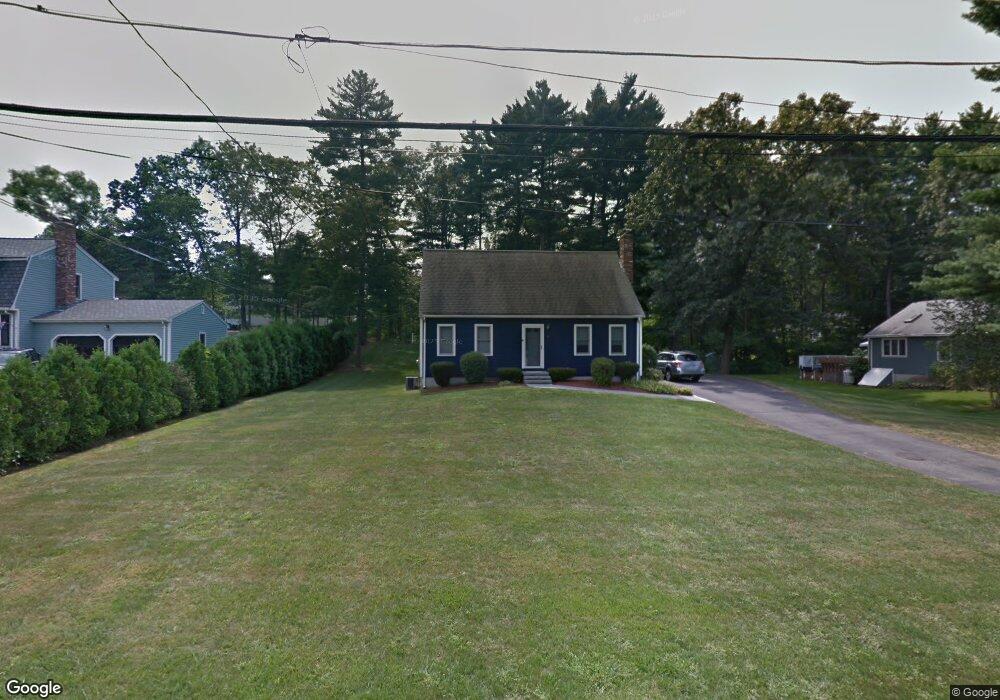
7 Marylyns Way Walpole, MA 02081
Estimated Value: $704,599 - $752,000
3
Beds
2
Baths
1,519
Sq Ft
$480/Sq Ft
Est. Value
About This Home
This home is located at 7 Marylyns Way, Walpole, MA 02081 and is currently estimated at $729,150, approximately $480 per square foot. 7 Marylyns Way is a home located in Norfolk County with nearby schools including Elm Street School, Eleanor N. Johnson Middle School, and Walpole High School.
Ownership History
Date
Name
Owned For
Owner Type
Purchase Details
Closed on
Jan 30, 2001
Sold by
Morrison Robert W and Morrison Mary E
Bought by
Mccarthy Arthur and Mccarthy Ellen M
Current Estimated Value
Home Financials for this Owner
Home Financials are based on the most recent Mortgage that was taken out on this home.
Original Mortgage
$260,900
Outstanding Balance
$96,426
Interest Rate
7.39%
Mortgage Type
Purchase Money Mortgage
Estimated Equity
$632,724
Purchase Details
Closed on
Dec 11, 1990
Sold by
Green David A
Bought by
Morrison Robert W
Home Financials for this Owner
Home Financials are based on the most recent Mortgage that was taken out on this home.
Original Mortgage
$140,000
Interest Rate
10.1%
Mortgage Type
Purchase Money Mortgage
Create a Home Valuation Report for This Property
The Home Valuation Report is an in-depth analysis detailing your home's value as well as a comparison with similar homes in the area
Home Values in the Area
Average Home Value in this Area
Purchase History
| Date | Buyer | Sale Price | Title Company |
|---|---|---|---|
| Mccarthy Arthur | $289,900 | -- | |
| Morrison Robert W | $175,000 | -- |
Source: Public Records
Mortgage History
| Date | Status | Borrower | Loan Amount |
|---|---|---|---|
| Open | Morrison Robert W | $260,900 | |
| Previous Owner | Morrison Robert W | $137,200 | |
| Previous Owner | Morrison Robert W | $140,000 | |
| Previous Owner | Morrison Robert W | $50,000 |
Source: Public Records
Tax History Compared to Growth
Tax History
| Year | Tax Paid | Tax Assessment Tax Assessment Total Assessment is a certain percentage of the fair market value that is determined by local assessors to be the total taxable value of land and additions on the property. | Land | Improvement |
|---|---|---|---|---|
| 2025 | $7,847 | $611,600 | $324,700 | $286,900 |
| 2024 | $7,621 | $576,500 | $312,200 | $264,300 |
| 2023 | $7,423 | $534,400 | $271,500 | $262,900 |
| 2022 | $7,020 | $485,500 | $251,500 | $234,000 |
| 2021 | $6,806 | $458,600 | $237,200 | $221,400 |
| 2020 | $6,777 | $452,100 | $223,800 | $228,300 |
| 2019 | $6,572 | $435,200 | $215,200 | $220,000 |
| 2018 | $6,102 | $399,600 | $207,700 | $191,900 |
| 2017 | $5,899 | $384,800 | $199,800 | $185,000 |
| 2016 | $5,762 | $370,300 | $192,100 | $178,200 |
| 2015 | $5,567 | $354,600 | $183,100 | $171,500 |
| 2014 | $5,284 | $335,300 | $183,100 | $152,200 |
Source: Public Records
Map
Nearby Homes
- 1391 Main St Unit 304
- 1391 Main St Unit 208
- 1391 Main St Unit 305
- 1391 Main St Unit 308
- 1648 Main St
- 13 Sandtrap Cir Unit 14
- 11 Sandtrap Cir Unit 15
- 20 Sandtrap Cir Unit 4
- 18 Sandtrap Cir Unit 3
- 17 Sandtrap Cir Unit 12
- 15 Sandtrap Cir Unit 13
- 10 Sandtrap Cir Unit 2
- 31 Sandtrap Cir Unit 5
- 66 Oak St
- 127 Clear Pond Dr
- 137 Clear Pond Dr
- 8 Autumn Ln
- 16 Magpie Cir Unit 16
- 18 Teal Cir
- 14 Tiger Terrace Unit 29