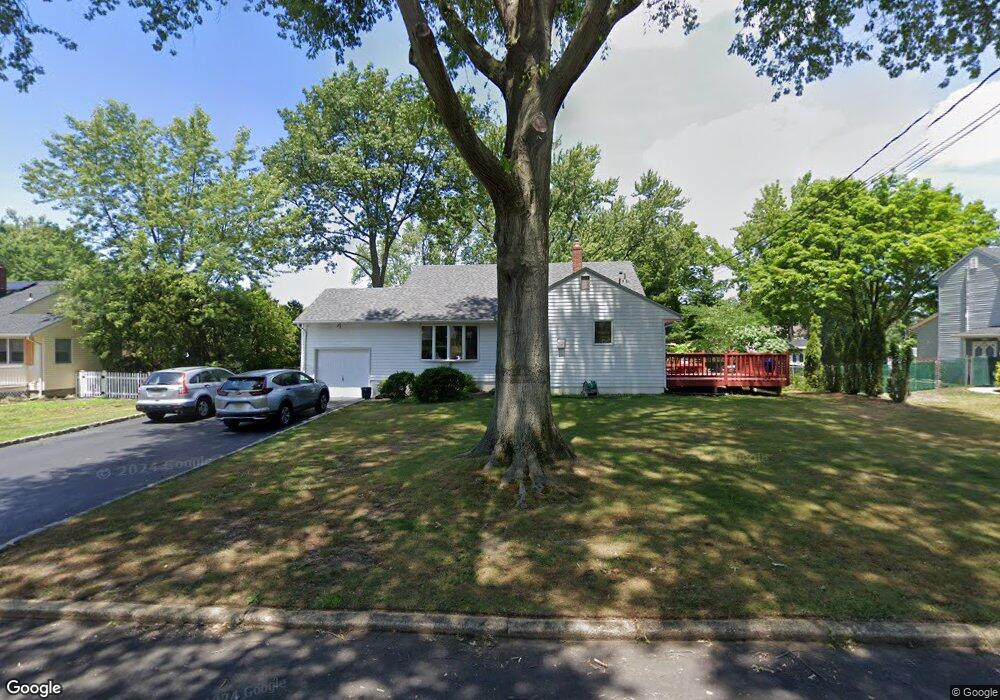
7 Mayfair Rd Holmdel, NJ 07733
Estimated Value: $635,591 - $700,000
3
Beds
1
Bath
1,500
Sq Ft
$443/Sq Ft
Est. Value
About This Home
This home is located at 7 Mayfair Rd, Holmdel, NJ 07733 and is currently estimated at $665,148, approximately $443 per square foot. 7 Mayfair Rd is a home located in Monmouth County with nearby schools including Village School, Indian Hill Elementary School, and William Satz Intermediate School.
Ownership History
Date
Name
Owned For
Owner Type
Purchase Details
Closed on
Dec 22, 2016
Sold by
Lamastra Kevin A
Bought by
Lamastra Kevin A and Lamastra Areti
Current Estimated Value
Home Financials for this Owner
Home Financials are based on the most recent Mortgage that was taken out on this home.
Original Mortgage
$264,225
Outstanding Balance
$126,300
Interest Rate
3.34%
Mortgage Type
New Conventional
Estimated Equity
$538,848
Purchase Details
Closed on
Dec 2, 1999
Sold by
Maulucci Domenick
Bought by
Lamastra Kevin
Home Financials for this Owner
Home Financials are based on the most recent Mortgage that was taken out on this home.
Original Mortgage
$183,350
Interest Rate
7.73%
Create a Home Valuation Report for This Property
The Home Valuation Report is an in-depth analysis detailing your home's value as well as a comparison with similar homes in the area
Home Values in the Area
Average Home Value in this Area
Purchase History
| Date | Buyer | Sale Price | Title Company |
|---|---|---|---|
| Lamastra Kevin A | -- | None Available | |
| Lamastra Kevin | $244,500 | -- |
Source: Public Records
Mortgage History
| Date | Status | Borrower | Loan Amount |
|---|---|---|---|
| Open | Lamastra Kevin A | $264,225 | |
| Closed | Lamastra Kevin | $183,350 |
Source: Public Records
Tax History
| Year | Tax Paid | Tax Assessment Tax Assessment Total Assessment is a certain percentage of the fair market value that is determined by local assessors to be the total taxable value of land and additions on the property. | Land | Improvement |
|---|---|---|---|---|
| 2025 | $9,023 | $586,000 | $402,500 | $183,500 |
| 2024 | $9,059 | $572,500 | $405,600 | $166,900 |
Source: Public Records
Map
Nearby Homes
Your Personal Tour Guide
Ask me questions while you tour the home.