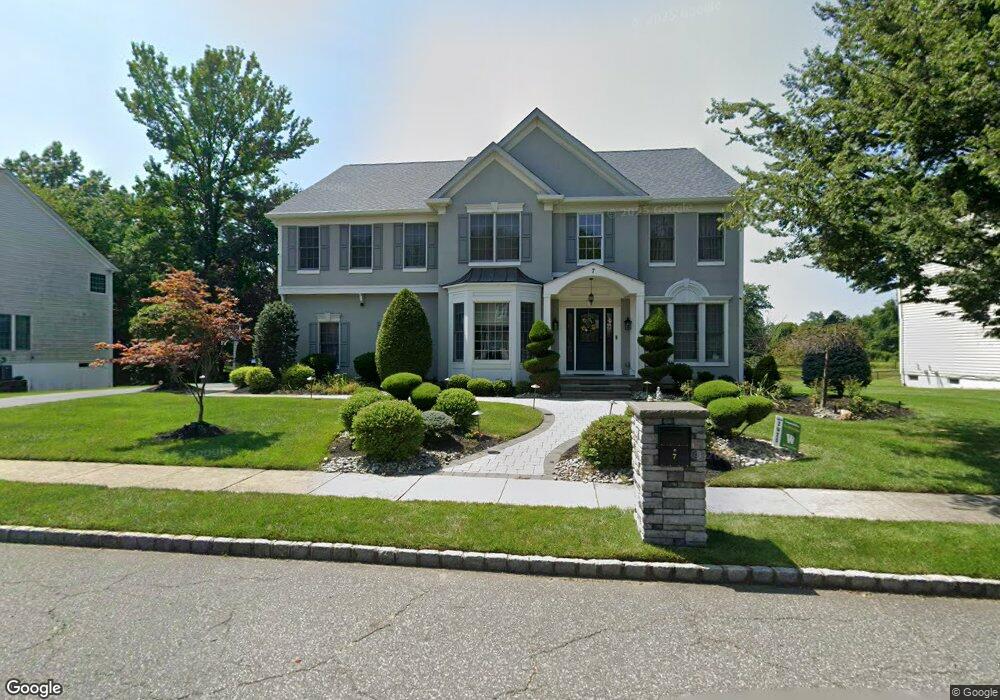
7 Mcginnis St East Brunswick, NJ 08816
Estimated Value: $964,675 - $1,211,000
4
Beds
4
Baths
3,464
Sq Ft
$322/Sq Ft
Est. Value
About This Home
This home is located at 7 Mcginnis St, East Brunswick, NJ 08816 and is currently estimated at $1,114,669, approximately $321 per square foot. 7 Mcginnis St is a home located in Middlesex County with nearby schools including Warnsdorfer Elementary School, Hammarskjold Upper Elementary School, and Churchill Junior High School.
Ownership History
Date
Name
Owned For
Owner Type
Purchase Details
Closed on
Dec 3, 2024
Sold by
Patel Arpit and Patel Reema
Bought by
Arp Family Trust and Patel
Current Estimated Value
Purchase Details
Closed on
May 8, 2015
Sold by
Pan George and Li Lingda
Bought by
Patel Arpit and Patel Reema
Home Financials for this Owner
Home Financials are based on the most recent Mortgage that was taken out on this home.
Original Mortgage
$536,080
Interest Rate
3.97%
Mortgage Type
New Conventional
Purchase Details
Closed on
Nov 26, 2003
Sold by
Pulte Homes Of New Jersey Lp
Bought by
Pan George and Lingda Li
Home Financials for this Owner
Home Financials are based on the most recent Mortgage that was taken out on this home.
Original Mortgage
$422,400
Interest Rate
5.82%
Create a Home Valuation Report for This Property
The Home Valuation Report is an in-depth analysis detailing your home's value as well as a comparison with similar homes in the area
Home Values in the Area
Average Home Value in this Area
Purchase History
| Date | Buyer | Sale Price | Title Company |
|---|---|---|---|
| Arp Family Trust | -- | None Listed On Document | |
| Arp Family Trust | -- | None Listed On Document | |
| Arp Family Trust | -- | None Listed On Document | |
| Patel Arpit | $670,100 | Weighert Title Agency | |
| Pan George | $528,500 | -- |
Source: Public Records
Mortgage History
| Date | Status | Borrower | Loan Amount |
|---|---|---|---|
| Previous Owner | Patel Arpit | $536,080 | |
| Previous Owner | Pan George | $422,400 |
Source: Public Records
Tax History Compared to Growth
Tax History
| Year | Tax Paid | Tax Assessment Tax Assessment Total Assessment is a certain percentage of the fair market value that is determined by local assessors to be the total taxable value of land and additions on the property. | Land | Improvement |
|---|---|---|---|---|
| 2025 | $20,678 | $168,500 | $50,000 | $118,500 |
| 2024 | $20,055 | $168,500 | $50,000 | $118,500 |
| 2023 | $20,055 | $168,500 | $50,000 | $118,500 |
| 2022 | $19,954 | $168,500 | $50,000 | $118,500 |
| 2021 | $19,197 | $168,500 | $50,000 | $118,500 |
| 2020 | $19,386 | $168,500 | $50,000 | $118,500 |
| 2019 | $17,488 | $153,500 | $50,000 | $103,500 |
| 2018 | $17,161 | $153,500 | $50,000 | $103,500 |
| 2017 | $16,842 | $153,500 | $50,000 | $103,500 |
| 2016 | $16,452 | $153,500 | $50,000 | $103,500 |
| 2015 | $16,058 | $153,500 | $50,000 | $103,500 |
| 2014 | $15,715 | $153,500 | $50,000 | $103,500 |
Source: Public Records
Map
Nearby Homes