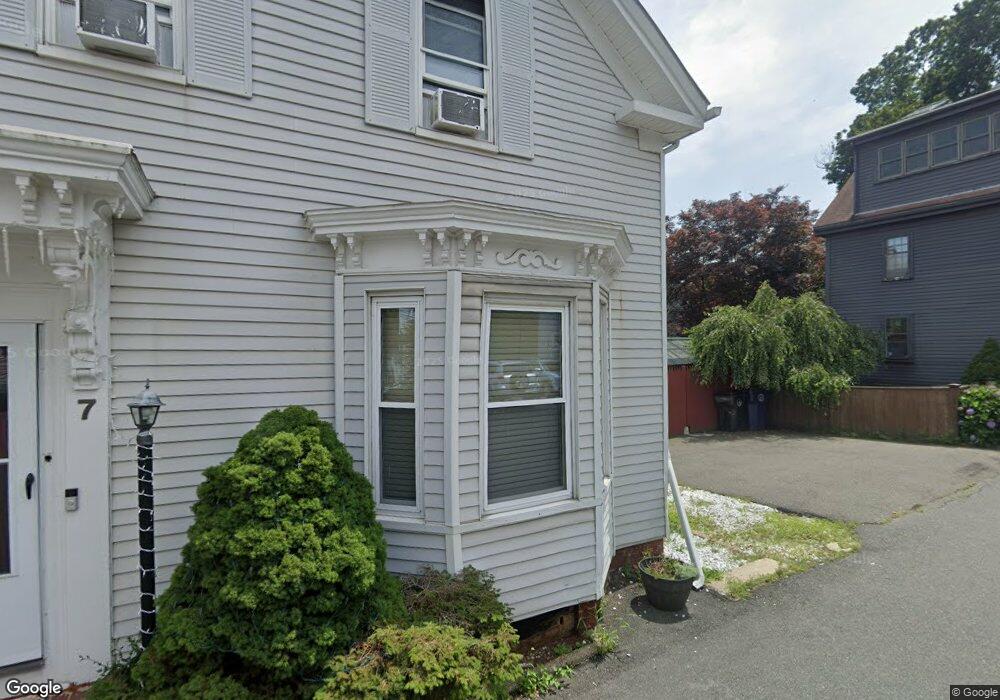
7 Mead Ct Salem, MA 01970
North Salem NeighborhoodEstimated Value: $578,000 - $788,000
3
Beds
1
Bath
1,200
Sq Ft
$534/Sq Ft
Est. Value
About This Home
This home is located at 7 Mead Ct, Salem, MA 01970 and is currently estimated at $640,813, approximately $534 per square foot. 7 Mead Ct is a home located in Essex County with nearby schools including Bates Elementary School, Saltonstall School, and Carlton Elementary School.
Ownership History
Date
Name
Owned For
Owner Type
Purchase Details
Closed on
Jun 20, 2007
Sold by
Murray Irene P
Bought by
Badolato Louis C
Current Estimated Value
Purchase Details
Closed on
Sep 10, 2001
Sold by
Hastings Roger
Bought by
Murray Irene P
Purchase Details
Closed on
Mar 29, 1994
Sold by
Fraser Delia M Est
Bought by
Hastings Roger
Home Financials for this Owner
Home Financials are based on the most recent Mortgage that was taken out on this home.
Original Mortgage
$74,000
Interest Rate
7.15%
Mortgage Type
Purchase Money Mortgage
Create a Home Valuation Report for This Property
The Home Valuation Report is an in-depth analysis detailing your home's value as well as a comparison with similar homes in the area
Home Values in the Area
Average Home Value in this Area
Purchase History
| Date | Buyer | Sale Price | Title Company |
|---|---|---|---|
| Badolato Louis C | $299,000 | -- | |
| Murray Irene P | $230,000 | -- | |
| Hastings Roger | $18,250 | -- | |
| Hastings Roger | $36,500 | -- |
Source: Public Records
Mortgage History
| Date | Status | Borrower | Loan Amount |
|---|---|---|---|
| Previous Owner | Hastings Roger | $15,000 | |
| Previous Owner | Hastings Roger | $74,000 |
Source: Public Records
Tax History
| Year | Tax Paid | Tax Assessment Tax Assessment Total Assessment is a certain percentage of the fair market value that is determined by local assessors to be the total taxable value of land and additions on the property. | Land | Improvement |
|---|---|---|---|---|
| 2025 | $6,039 | $532,500 | $190,800 | $341,700 |
| 2024 | $5,844 | $502,900 | $181,300 | $321,600 |
| 2023 | $5,663 | $452,700 | $167,400 | $285,300 |
| 2022 | $5,456 | $411,800 | $161,800 | $250,000 |
| 2021 | $5,372 | $389,300 | $150,600 | $238,700 |
| 2020 | $5,114 | $353,900 | $142,300 | $211,600 |
| 2019 | $5,087 | $336,900 | $135,000 | $201,900 |
| 2018 | $4,931 | $320,600 | $128,300 | $192,300 |
| 2017 | $4,590 | $289,400 | $108,200 | $181,200 |
| 2016 | $4,457 | $284,400 | $103,200 | $181,200 |
| 2015 | $4,230 | $257,800 | $94,900 | $162,900 |
Source: Public Records
Map
Nearby Homes
- 40 Buffum St Unit 2
- 40 Buffum St Unit 1
- 112 North St
- 21 Manning St
- 3 S Mason St
- 44 Orne St Unit 44
- 16 Franklin St Unit 2403
- 16 Franklin St Unit 1303
- 41 Dearborn St
- 16 River St
- 23 River St
- 86 Flint St
- 16 Oakland St
- 17 North St Unit 2
- 65 Washington St Unit 512
- 289 Essex St Unit 211
- 11 Summer St
- 35 Flint St Unit 209
- 35 Flint St Unit 106
- 9 Highland St
Your Personal Tour Guide
Ask me questions while you tour the home.