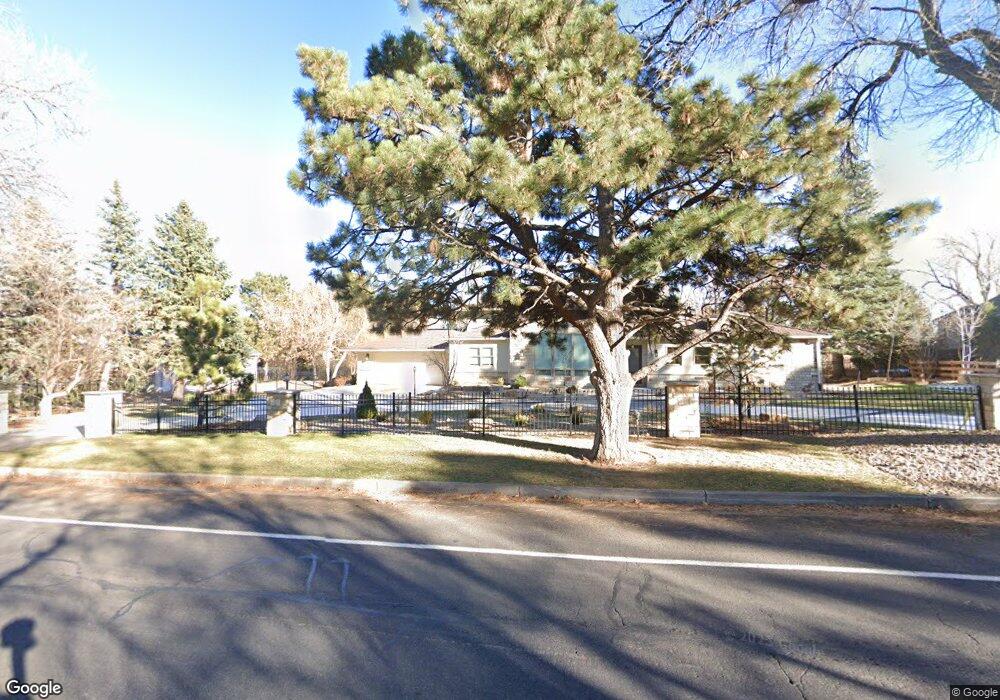
7 Mirada Rd Colorado Springs, CO 80906
Broadmoor NeighborhoodEstimated Value: $1,170,000 - $1,977,000
8
Beds
6
Baths
4,419
Sq Ft
$340/Sq Ft
Est. Value
About This Home
This home is located at 7 Mirada Rd, Colorado Springs, CO 80906 and is currently estimated at $1,502,553, approximately $340 per square foot. 7 Mirada Rd is a home located in El Paso County with nearby schools including Broadmoor Elementary School, Cheyenne Mountain Junior High School, and Cheyenne Mountain High School.
Ownership History
Date
Name
Owned For
Owner Type
Purchase Details
Closed on
Jan 25, 2021
Sold by
Dawod Muath and Ali Nour
Bought by
Devon Bank
Current Estimated Value
Home Financials for this Owner
Home Financials are based on the most recent Mortgage that was taken out on this home.
Original Mortgage
$600,110
Outstanding Balance
$438,417
Interest Rate
2.67%
Mortgage Type
New Conventional
Estimated Equity
$1,064,136
Purchase Details
Closed on
Jan 12, 2021
Sold by
Devon Bank
Bought by
Dawod Muath and Ali Nour
Home Financials for this Owner
Home Financials are based on the most recent Mortgage that was taken out on this home.
Original Mortgage
$600,110
Outstanding Balance
$438,417
Interest Rate
2.67%
Mortgage Type
New Conventional
Estimated Equity
$1,064,136
Purchase Details
Closed on
Oct 29, 2020
Sold by
Wetzig Carol Lee
Bought by
Dawod Muath and Ali Nour
Purchase Details
Closed on
Jun 8, 1988
Bought by
Wetzig Carl K and Wetzig Carol L
Create a Home Valuation Report for This Property
The Home Valuation Report is an in-depth analysis detailing your home's value as well as a comparison with similar homes in the area
Home Values in the Area
Average Home Value in this Area
Purchase History
| Date | Buyer | Sale Price | Title Company |
|---|---|---|---|
| Devon Bank | -- | Land Title Guarantee Company | |
| Dawod Muath | -- | Land Title Guarantee Company | |
| Dawod Muath | $919,632 | Land Title Guarantee | |
| Wetzig Carl K | -- | -- |
Source: Public Records
Mortgage History
| Date | Status | Borrower | Loan Amount |
|---|---|---|---|
| Open | Dawod Muath | $600,110 |
Source: Public Records
Tax History Compared to Growth
Tax History
| Year | Tax Paid | Tax Assessment Tax Assessment Total Assessment is a certain percentage of the fair market value that is determined by local assessors to be the total taxable value of land and additions on the property. | Land | Improvement |
|---|---|---|---|---|
| 2025 | $6,011 | $82,160 | -- | -- |
| 2024 | $5,909 | $85,110 | $41,370 | $43,740 |
| 2022 | $5,658 | $77,890 | $37,440 | $40,450 |
| 2021 | $5,966 | $80,130 | $38,520 | $41,610 |
| 2020 | $5,674 | $74,400 | $34,390 | $40,010 |
| 2019 | $5,613 | $74,400 | $34,390 | $40,010 |
| 2018 | $5,307 | $69,110 | $32,760 | $36,350 |
| 2017 | $5,287 | $69,110 | $32,760 | $36,350 |
| 2016 | $5,380 | $72,120 | $34,150 | $37,970 |
| 2015 | $5,369 | $72,120 | $34,150 | $37,970 |
| 2014 | $5,117 | $68,680 | $29,800 | $38,880 |
Source: Public Records
Map
Nearby Homes
- 9 Broadmoor Ave
- 34 Marland Rd
- 3520 Sebastian Heights
- 26 Hutton Ln
- 250 Mayfield Ln
- 27 Broadmoor Ave
- 744 Count Pourtales Dr
- 18 2nd St
- 526 Penrose Blvd
- 10 5th St
- 704 Count Pourtales Dr
- 505 Penrose Blvd
- 4 2nd St
- 129 Mayhurst Ave Unit 129
- 17 Midland Rd
- 104 Marland Rd S
- 5 Penrose Blvd
- 1609 W Cheyenne Rd
- 2805 Old Broadmoor Rd
- 3755 Hermitage Dr
- 9 Mirada Rd
- 5 Mirada Rd
- 50 Cheyenne Mountain Blvd
- 46 Cheyenne Mountain Blvd
- 54 Cheyenne Mountain Blvd
- 3 Mirada Rd
- 42 Cheyenne Mountain Blvd
- 58 Cheyenne Mountain Blvd
- 13 Mirada Rd
- 29 Cheyenne Mountain Blvd
- 1 Mirada Rd
- 53 Cheyenne Mountain Blvd
- 41 Cheyenne Mountain Blvd
- 38 Cheyenne Mountain Blvd
- 16 Northgate Rd
- 31 Cheyenne Mountain Blvd
- 28 Westgate Rd
- 14 Northgate Rd
- 64 Cheyenne Mountain Blvd
- 64 W Cheyenne Mountain Blvd