Estimated Value: $160,000 - $184,000
3
Beds
2
Baths
1,074
Sq Ft
$163/Sq Ft
Est. Value
About This Home
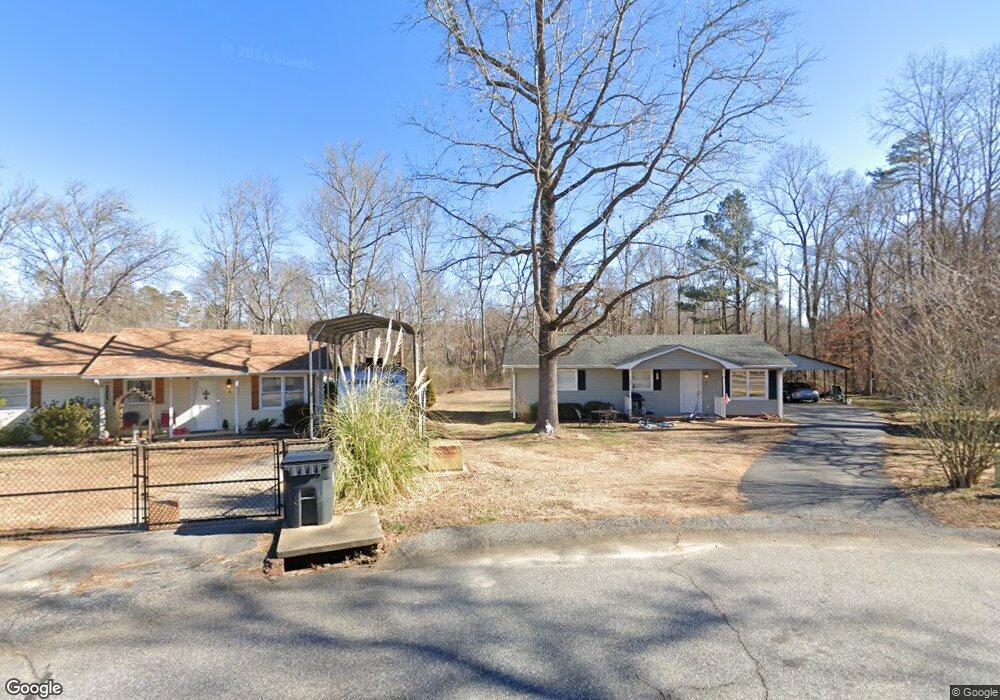
This home is located at 7 Mitchell Ct, Inman, SC 29349 and is currently estimated at $174,562, approximately $162 per square foot. 7 Mitchell Ct is a home located in Spartanburg County with nearby schools including Dorman High School Freshman Campus, Dorman High School, and Inman Christian Academy.
Ownership History
Date
Name
Owned For
Owner Type
Purchase Details
Closed on
Aug 5, 2020
Sold by
A & T Holdings Llc
Bought by
Gosnell Jonathan
Current Estimated Value
Home Financials for this Owner
Home Financials are based on the most recent Mortgage that was taken out on this home.
Original Mortgage
$99,170
Outstanding Balance
$87,971
Interest Rate
3%
Mortgage Type
FHA
Estimated Equity
$86,591
Purchase Details
Closed on
Jul 17, 2017
Sold by
Rice Tuler C
Bought by
A & T Holdings Llc
Purchase Details
Closed on
Mar 20, 2007
Sold by
The Bank Of New York
Bought by
Rice Tyler C
Home Financials for this Owner
Home Financials are based on the most recent Mortgage that was taken out on this home.
Original Mortgage
$56,500
Interest Rate
6.1%
Mortgage Type
Purchase Money Mortgage
Purchase Details
Closed on
Dec 13, 2006
Sold by
Johnson Donna C
Bought by
The Bank Of New York and Eqcc Asset Backed Certificates Series 20
Create a Home Valuation Report for This Property
The Home Valuation Report is an in-depth analysis detailing your home's value as well as a comparison with similar homes in the area
Home Values in the Area
Average Home Value in this Area
Purchase History
| Date | Buyer | Sale Price | Title Company |
|---|---|---|---|
| Gosnell Jonathan | $101,000 | None Available | |
| A & T Holdings Llc | -- | None Available | |
| Rice Tyler C | $56,500 | None Available | |
| The Bank Of New York | $2,500 | None Available |
Source: Public Records
Mortgage History
| Date | Status | Borrower | Loan Amount |
|---|---|---|---|
| Open | Gosnell Jonathan | $99,170 | |
| Previous Owner | Rice Tyler C | $56,500 |
Source: Public Records
Tax History
| Year | Tax Paid | Tax Assessment Tax Assessment Total Assessment is a certain percentage of the fair market value that is determined by local assessors to be the total taxable value of land and additions on the property. | Land | Improvement |
|---|---|---|---|---|
| 2022 | $737 | $4,040 | $600 | $3,440 |
| 2021 | $737 | $4,040 | $600 | $3,440 |
| 2020 | $612 | $3,368 | $600 | $2,768 |
| 2019 | $1,896 | $5,052 | $900 | $4,152 |
| 2018 | $1,896 | $5,052 | $900 | $4,152 |
| 2017 | $1,612 | $4,362 | $900 | $3,462 |
| 2016 | $1,597 | $4,362 | $900 | $3,462 |
| 2015 | $523 | $2,908 | $600 | $2,308 |
| 2014 | $504 | $2,908 | $600 | $2,308 |
Source: Public Records
Map
Nearby Homes
- 108 Everest Dr
- 107 Everest Dr
- 105 Everest Dr
- 416 Pisgah Ln
- 502 Pleasant Green Dr
- 430 Bud Farmer Place
- 602 E Dateria Way
- 393 Split Oak Ln
- 381 Split Oak Ln
- 361 Split Oak Ln
- 834 John Weaver Trace
- 235,237 Bobo Dr
- 505 Treasure Cove
- 551 Dayspring Dr
- 1525 Settle Rd
- 1519 Settle Rd
- 603 Ezra Ct
- 224 W Clark Rd
- 1592 Settle Rd
- 1763 Watersail Ln
Your Personal Tour Guide
Ask me questions while you tour the home.