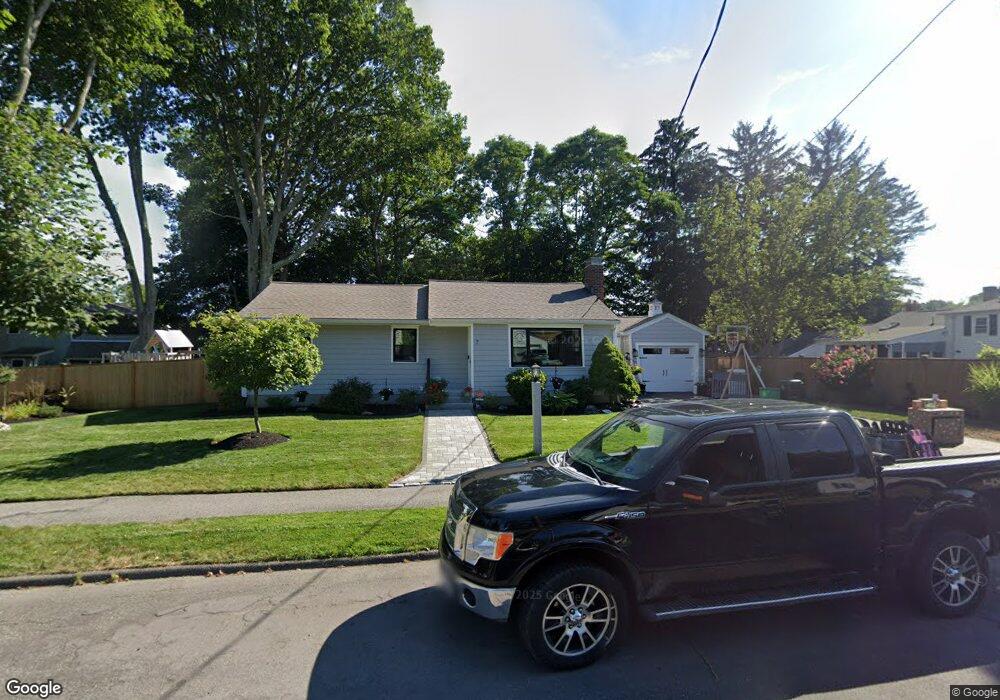
7 Morningside Dr Danvers, MA 01923
Estimated Value: $688,402 - $720,000
3
Beds
2
Baths
1,790
Sq Ft
$396/Sq Ft
Est. Value
About This Home
This home is located at 7 Morningside Dr, Danvers, MA 01923 and is currently estimated at $708,101, approximately $395 per square foot. 7 Morningside Dr is a home located in Essex County with nearby schools including Danvers High School, St. Mary of the Annunciation School, and St. John's Prep.
Ownership History
Date
Name
Owned For
Owner Type
Purchase Details
Closed on
Jun 28, 2020
Sold by
Hoffman Benjamin F
Bought by
Jones Derek and Jones Jennifer
Current Estimated Value
Home Financials for this Owner
Home Financials are based on the most recent Mortgage that was taken out on this home.
Original Mortgage
$466,445
Outstanding Balance
$410,717
Interest Rate
3.2%
Mortgage Type
New Conventional
Estimated Equity
$297,384
Purchase Details
Closed on
Apr 28, 2011
Sold by
Whitney Blake and Whitney Ashley
Bought by
Hoffman Benjamin F
Home Financials for this Owner
Home Financials are based on the most recent Mortgage that was taken out on this home.
Original Mortgage
$252,500
Interest Rate
4.76%
Mortgage Type
Purchase Money Mortgage
Purchase Details
Closed on
Apr 20, 2006
Sold by
Weichert Relocation Rs
Bought by
Whitney Blake and Whitney Ashley
Purchase Details
Closed on
Sep 30, 2002
Sold by
Hrdy Ft and Hrdy
Bought by
Ruehl Willi H and Ruehl Bianca
Purchase Details
Closed on
Oct 14, 1994
Sold by
Seven Morningside Dr and Linehan
Bought by
Hardy Michael A and Hrdy Pauline
Purchase Details
Closed on
Apr 27, 1988
Sold by
G & T Bldrs Inc
Bought by
Sciacca Domenick A
Create a Home Valuation Report for This Property
The Home Valuation Report is an in-depth analysis detailing your home's value as well as a comparison with similar homes in the area
Home Values in the Area
Average Home Value in this Area
Purchase History
| Date | Buyer | Sale Price | Title Company |
|---|---|---|---|
| Jones Derek | $492,500 | None Available | |
| Hoffman Benjamin F | $325,900 | -- | |
| Whitney Blake | $379,900 | -- | |
| Weichert Relocation Rs | $379,900 | -- | |
| Ruehl Willi H | $352,000 | -- | |
| Hardy Michael A | $168,000 | -- | |
| Sciacca Domenick A | $110,000 | -- |
Source: Public Records
Mortgage History
| Date | Status | Borrower | Loan Amount |
|---|---|---|---|
| Open | Jones Derek | $466,445 | |
| Previous Owner | Sciacca Domenick A | $252,000 | |
| Previous Owner | Sciacca Domenick A | $252,500 |
Source: Public Records
Tax History
| Year | Tax Paid | Tax Assessment Tax Assessment Total Assessment is a certain percentage of the fair market value that is determined by local assessors to be the total taxable value of land and additions on the property. | Land | Improvement |
|---|---|---|---|---|
| 2025 | $6,541 | $595,200 | $341,500 | $253,700 |
| 2024 | $6,522 | $587,000 | $341,500 | $245,500 |
| 2023 | $6,246 | $531,600 | $310,300 | $221,300 |
| 2022 | $6,124 | $483,700 | $281,600 | $202,100 |
| 2021 | $5,857 | $438,700 | $266,700 | $172,000 |
| 2020 | $5,680 | $434,900 | $263,600 | $171,300 |
| 2019 | $5,457 | $410,900 | $239,600 | $171,300 |
| 2018 | $5,268 | $389,100 | $237,300 | $151,800 |
| 2017 | $5,066 | $357,000 | $207,300 | $149,700 |
| 2016 | $4,837 | $340,600 | $197,700 | $142,900 |
| 2015 | $4,607 | $309,000 | $179,700 | $129,300 |
Source: Public Records
Map
Nearby Homes
- 2 Chapel Rd
- 14 Grove St
- 35 Locust St Unit 3
- 55 Burley St
- 20 Central Ave
- 14 Chase St
- 22 Maple Ave
- 6 Venice St Unit B3
- 35 High St Unit 3D
- 43 Hobart St Unit B
- 5 Holten St
- 12 Tulane Rd
- 11 Riverside Ave Unit 111
- 14 Williams St Unit C17
- 34 Bayview Terrace Unit 5
- 6 Colby Rd
- 6 Grant St
- 44 Foster St
- 10 Clark St
- 147 High St
Your Personal Tour Guide
Ask me questions while you tour the home.