Estimated Value: $82,000 - $160,000
5
Beds
2
Baths
1,248
Sq Ft
$99/Sq Ft
Est. Value
About This Home
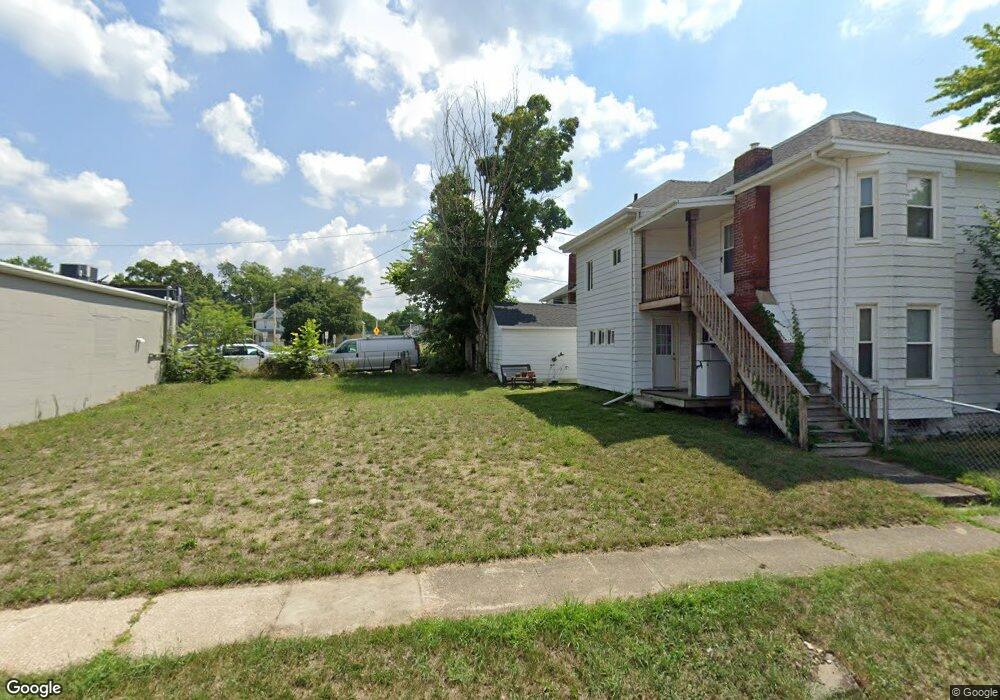
This home is located at 7 N 9th St, Niles, MI 49120 and is currently estimated at $124,000, approximately $99 per square foot. 7 N 9th St is a home located in Berrien County with nearby schools including Ballard Elementary School, Oak Manor Sixth Grade Center, and Ring Lardner Middle School.
Ownership History
Date
Name
Owned For
Owner Type
Purchase Details
Closed on
Jun 17, 2024
Sold by
Swartz Donald L
Bought by
Berrien County Treasurer
Current Estimated Value
Purchase Details
Closed on
Jun 14, 2024
Sold by
Swartz Donald L
Bought by
Berrien County Treasurer
Purchase Details
Closed on
Aug 22, 2003
Sold by
Federal National Mortgage Association
Bought by
Swartz Donald L
Purchase Details
Closed on
Dec 29, 2002
Sold by
Countrywide Home Loans Inc
Bought by
Federal National Mortgage Association
Purchase Details
Closed on
Dec 19, 2002
Sold by
Little Joyce A and Swartz Teresa L
Bought by
Countrywide Home Loans Inc
Purchase Details
Closed on
Oct 12, 1999
Purchase Details
Closed on
Nov 2, 1995
Create a Home Valuation Report for This Property
The Home Valuation Report is an in-depth analysis detailing your home's value as well as a comparison with similar homes in the area
Home Values in the Area
Average Home Value in this Area
Purchase History
| Date | Buyer | Sale Price | Title Company |
|---|---|---|---|
| Berrien County Treasurer | -- | -- | |
| Berrien County Treasurer | -- | -- | |
| Swartz Donald L | $31,000 | Meridian Title Corp | |
| Federal National Mortgage Association | -- | -- | |
| Countrywide Home Loans Inc | $56,347 | -- | |
| -- | $100 | -- | |
| -- | -- | -- |
Source: Public Records
Tax History
| Year | Tax Paid | Tax Assessment Tax Assessment Total Assessment is a certain percentage of the fair market value that is determined by local assessors to be the total taxable value of land and additions on the property. | Land | Improvement |
|---|---|---|---|---|
| 2025 | $167 | $3,900 | $0 | $0 |
| 2024 | $157 | $2,900 | $0 | $0 |
| 2023 | $964 | $44,200 | $0 | $0 |
| 2022 | $918 | $34,200 | $0 | $0 |
| 2021 | $1,668 | $31,900 | $1,800 | $30,100 |
| 2020 | $1,649 | $30,000 | $0 | $0 |
| 2019 | $1,625 | $29,500 | $1,200 | $28,300 |
| 2018 | $1,655 | $29,500 | $0 | $0 |
| 2017 | $1,646 | $36,100 | $0 | $0 |
| 2016 | $1,617 | $34,100 | $0 | $0 |
| 2015 | $1,612 | $32,500 | $0 | $0 |
| 2014 | $848 | $30,900 | $0 | $0 |
Source: Public Records
Map
Nearby Homes
Your Personal Tour Guide
Ask me questions while you tour the home.