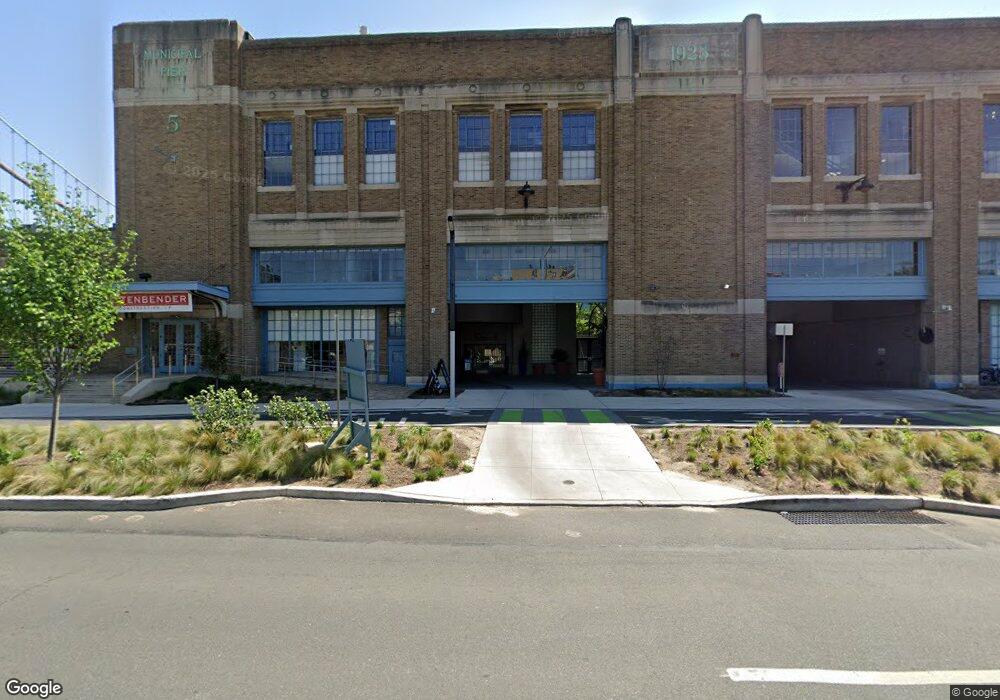
7 N Columbus Blvd Unit 119 Philadelphia, PA 19106
Old City NeighborhoodEstimated Value: $423,000 - $1,462,177
2
Beds
2
Baths
2,243
Sq Ft
$369/Sq Ft
Est. Value
About This Home
This home is located at 7 N Columbus Blvd Unit 119, Philadelphia, PA 19106 and is currently estimated at $828,544, approximately $369 per square foot. 7 N Columbus Blvd Unit 119 is a home located in Philadelphia County with nearby schools including General George A McCall Public School, Benjamin Franklin High School, and Mastery Charter High School Lenfest Campus.
Ownership History
Date
Name
Owned For
Owner Type
Purchase Details
Closed on
Jun 26, 2021
Sold by
Kogan Purnama and Kogan Daniel
Bought by
Krystal J Kim Revocable Trust
Current Estimated Value
Purchase Details
Closed on
Oct 2, 2018
Sold by
Scannella Joan M
Bought by
Kogan Purnama
Home Financials for this Owner
Home Financials are based on the most recent Mortgage that was taken out on this home.
Original Mortgage
$400,000
Interest Rate
4.5%
Mortgage Type
New Conventional
Purchase Details
Closed on
Dec 14, 2015
Sold by
Harvilla Gary S and Scannella Joan M
Bought by
Scannella Joan M and Harvilla Joan M
Purchase Details
Closed on
Dec 2, 2014
Sold by
Hsbc Bank Usa Na
Bought by
Harvilla Gary S and Harvilla Joan
Purchase Details
Closed on
Jun 4, 2014
Sold by
Shaw Melonease
Bought by
Hsbc Bank Usa Na
Create a Home Valuation Report for This Property
The Home Valuation Report is an in-depth analysis detailing your home's value as well as a comparison with similar homes in the area
Home Values in the Area
Average Home Value in this Area
Purchase History
| Date | Buyer | Sale Price | Title Company |
|---|---|---|---|
| Krystal J Kim Revocable Trust | $1,500,000 | None Available | |
| Kogan Purnama | $500,000 | None Available | |
| Scannella Joan M | -- | None Available | |
| Harvilla Gary S | $260,000 | None Available | |
| Hsbc Bank Usa Na | $170,000 | None Available |
Source: Public Records
Mortgage History
| Date | Status | Borrower | Loan Amount |
|---|---|---|---|
| Previous Owner | Kogan Purnama | $400,000 |
Source: Public Records
Tax History Compared to Growth
Tax History
| Year | Tax Paid | Tax Assessment Tax Assessment Total Assessment is a certain percentage of the fair market value that is determined by local assessors to be the total taxable value of land and additions on the property. | Land | Improvement |
|---|---|---|---|---|
| 2026 | $6,250 | $455,400 | $68,200 | $387,200 |
| 2025 | $6,250 | $455,400 | $68,200 | $387,200 |
| 2024 | $6,250 | $455,400 | $68,200 | $387,200 |
| 2023 | $6,250 | $446,500 | $66,900 | $379,600 |
| 2022 | $4,253 | $401,500 | $66,900 | $334,600 |
| 2021 | $4,883 | $0 | $0 | $0 |
| 2020 | $4,883 | $348,800 | $52,300 | $296,500 |
| 2019 | $4,563 | $0 | $0 | $0 |
| 2018 | $4,265 | $0 | $0 | $0 |
| 2017 | $4,265 | $0 | $0 | $0 |
| 2016 | $5,361 | $0 | $0 | $0 |
| 2015 | $5,132 | $0 | $0 | $0 |
| 2014 | -- | $383,000 | $104,700 | $278,300 |
| 2012 | -- | $73,312 | $2,797 | $70,515 |
Source: Public Records
Map
Nearby Homes
- 7 N Christopher Columbus Blvd Unit 130
- 3 N Columbus Blvd Unit 111
- 3 N Columbus Blvd Unit TD405
- 3 N Chris Columbus Blvd Unit PL228
- 50 N Front St Unit 502
- 19 Cuthbert St Unit B
- 50 56 N Front St Unit 101
- 116 Quarry St
- 152 N Front St
- 112 N 2nd St Unit 5F5
- 102-22 Church St Unit 402
- 117 Quarry St Unit 9
- 11 -15 N 2nd St Unit 306
- 141 45 N 2nd St Unit 3C
- 124 N 2nd St Unit 4
- 124 N 2nd St Unit PH
- 22 S Front St Unit 305
- 22 S Front St Unit 603
- 12 16 S Letitia St Unit 204
- 12 16 S Letitia St Unit 103
- 7 N Columbus Blvd Unit 201
- 7 N Columbus Blvd Unit 125
- 7 N Columbus Blvd Unit 117
- 7 N Columbus Blvd Unit 113
- 7 N Columbus Blvd Unit 127
- 7 N Columbus Blvd Unit 104
- 7 N Columbus Blvd Unit 120
- 7 N Columbus Blvd Unit 245
- 7 N Columbus Blvd Unit 112
- 7 N Columbus Blvd Unit 230
- 7 N Columbus Blvd Unit 224
- 7 N Columbus Blvd Unit 226
- 7 N Columbus Blvd Unit 234
- 7 N Columbus Blvd Unit 122
- 7 N Columbus Blvd Unit 133
- 7 N Columbus Blvd Unit 105
- 7 N Columbus Blvd Unit 118
- 7 N Columbus Blvd Unit 235
- 7 N Columbus Blvd Unit 223
- 7 N Columbus Blvd Unit 103