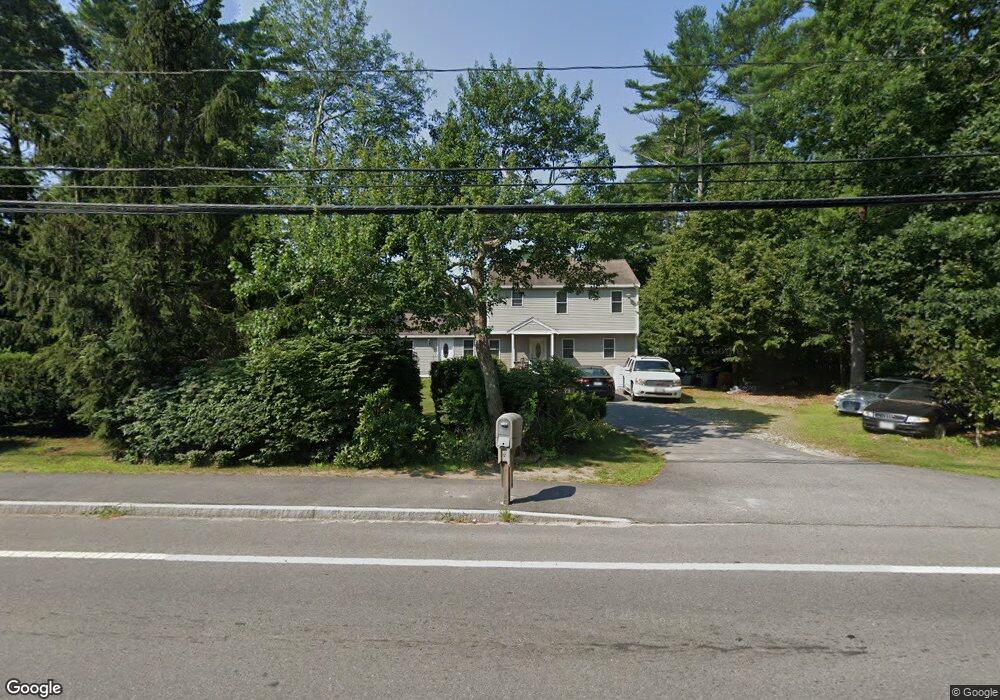
7 N Main St Carver, MA 02330
Estimated Value: $488,000 - $542,000
3
Beds
1
Bath
1,078
Sq Ft
$477/Sq Ft
Est. Value
About This Home
This home is located at 7 N Main St, Carver, MA 02330 and is currently estimated at $514,693, approximately $477 per square foot. 7 N Main St is a home located in Plymouth County with nearby schools including Carver Elementary School and Samuel Fuller School.
Ownership History
Date
Name
Owned For
Owner Type
Purchase Details
Closed on
Mar 24, 2006
Sold by
National City Bk India
Bought by
Department Of Housing & Urban Dev
Current Estimated Value
Home Financials for this Owner
Home Financials are based on the most recent Mortgage that was taken out on this home.
Original Mortgage
$242,500
Outstanding Balance
$136,889
Interest Rate
6.15%
Mortgage Type
Purchase Money Mortgage
Estimated Equity
$377,804
Purchase Details
Closed on
Mar 10, 2006
Sold by
Department Of Housing & Urban Dev
Bought by
Collins Melissa M
Home Financials for this Owner
Home Financials are based on the most recent Mortgage that was taken out on this home.
Original Mortgage
$242,500
Outstanding Balance
$136,889
Interest Rate
6.15%
Mortgage Type
Purchase Money Mortgage
Estimated Equity
$377,804
Purchase Details
Closed on
Nov 21, 2003
Sold by
Barrett Renee and Corey Dean I
Bought by
Neil Dennis A
Purchase Details
Closed on
Dec 28, 1999
Sold by
Barrett Wayne E and Barrett Renee R
Bought by
Barrett Renee R
Purchase Details
Closed on
Feb 3, 1994
Sold by
Novinsky Norman
Bought by
Barrett Wayne E and Barrett Renee R
Create a Home Valuation Report for This Property
The Home Valuation Report is an in-depth analysis detailing your home's value as well as a comparison with similar homes in the area
Home Values in the Area
Average Home Value in this Area
Purchase History
| Date | Buyer | Sale Price | Title Company |
|---|---|---|---|
| Department Of Housing & Urban Dev | -- | -- | |
| Collins Melissa M | $250,000 | -- | |
| Neil Dennis A | $272,800 | -- | |
| Barrett Renee R | $7,000 | -- | |
| Barrett Wayne E | $107,000 | -- | |
| Barrett Wayne E | $107,000 | -- |
Source: Public Records
Mortgage History
| Date | Status | Borrower | Loan Amount |
|---|---|---|---|
| Open | Barrett Wayne E | $242,500 | |
| Closed | Barrett Wayne E | $10,000 |
Source: Public Records
Tax History Compared to Growth
Tax History
| Year | Tax Paid | Tax Assessment Tax Assessment Total Assessment is a certain percentage of the fair market value that is determined by local assessors to be the total taxable value of land and additions on the property. | Land | Improvement |
|---|---|---|---|---|
| 2025 | $6,303 | $454,400 | $130,800 | $323,600 |
| 2024 | $6,215 | $438,600 | $128,300 | $310,300 |
| 2023 | $5,886 | $403,400 | $128,300 | $275,100 |
| 2022 | $5,537 | $346,500 | $109,700 | $236,800 |
| 2021 | $5,311 | $313,500 | $97,900 | $215,600 |
| 2020 | $5,049 | $293,700 | $91,500 | $202,200 |
| 2019 | $4,866 | $285,400 | $88,800 | $196,600 |
| 2018 | $4,677 | $265,300 | $88,800 | $176,500 |
| 2017 | $4,468 | $252,600 | $85,500 | $167,100 |
| 2016 | $3,997 | $234,700 | $81,400 | $153,300 |
| 2015 | $3,878 | $228,000 | $81,400 | $146,600 |
| 2014 | $3,826 | $224,900 | $102,900 | $122,000 |
Source: Public Records
Map
Nearby Homes
- 23 Shaw St
- 35 Silva St
- 7 Green St
- 11 Brockton Ave
- 26 Santana Way Unit 26
- 135 Plymouth St
- 81 Center St
- 18 Russell Holmes Way
- Lot1 Elk Run Dr
- 6 Susan Cir
- 64 Wenham Rd
- 5 Carver Square Blvd Unit 5
- 5 Carver Square Blvd
- 235 Main St
- 269 Purchase St
- 141 Rocky Meadow St
- 6 Kestrel Way
- 122 High St
- 20 Spring St
- 6 Twin Pines Ln Unit 6