
Landlord's Agent in 2023
Mike Huang
Lewis & Joyce Real Estate
(781) 888-8133
4 in this area
103 Total Sales
Estimated Value: $336,000 - $364,000
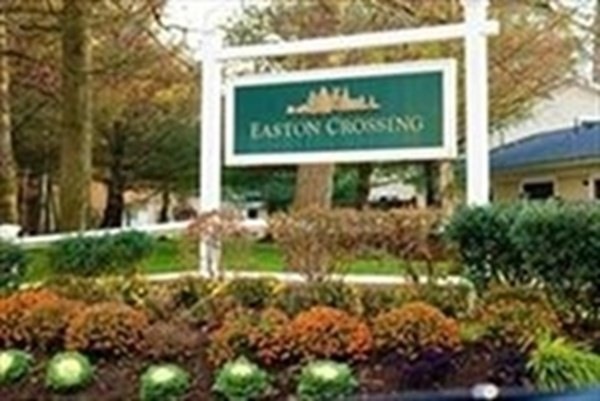
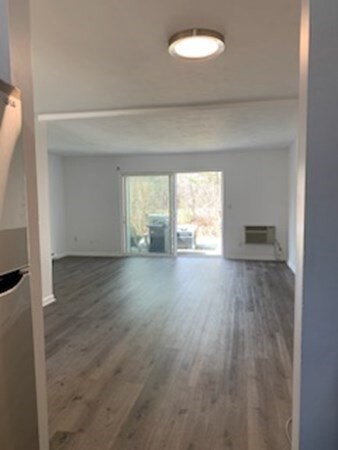
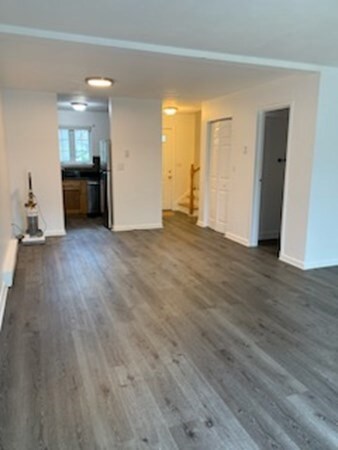
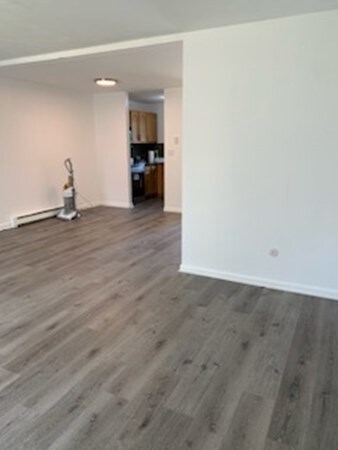
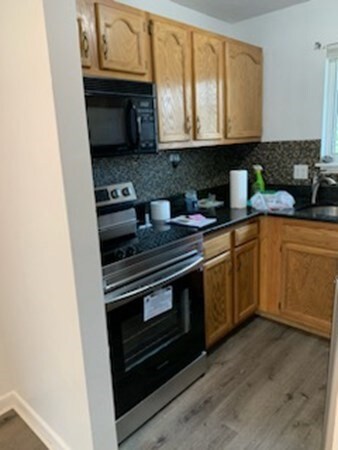
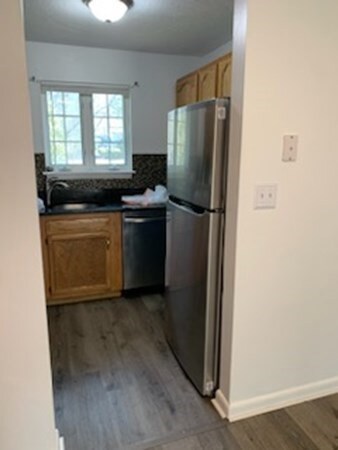
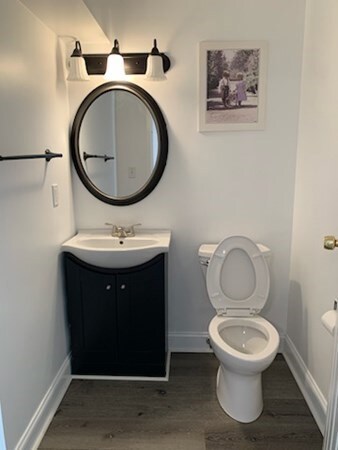
Gorgeous Townhouse in Easton Crossing with tons of natural light! Wonderful community to call home with loads of amenities including, tennis courts, basketball court, fitness center, pool and more! ! This unit has an open floor plan with new laminate floors and new paint through out the house. Living room has a private patio for additional outdoor space. Second floor has two large bedrooms, full bathroom, washer and dryer. A MUST SEE!
| Date | Buyer | Sale Price | Title Company |
|---|---|---|---|
| Wong Wai C | $217,500 | -- | |
| Wong Wai C | $217,500 | -- |
| Date | Status | Borrower | Loan Amount |
|---|---|---|---|
| Open | Wong Wai C | $163,125 | |
| Closed | Wong Wai C | $163,125 |
| Date | Event | Price | List to Sale | Price per Sq Ft | Prior Sale |
|---|---|---|---|---|---|
| 06/01/2023 06/01/23 | Rented | $2,200 | +2.3% | -- | |
| 05/23/2023 05/23/23 | Under Contract | -- | -- | -- | |
| 03/29/2023 03/29/23 | For Rent | $2,150 | +16.2% | -- | |
| 08/19/2019 08/19/19 | Rented | $1,850 | 0.0% | -- | |
| 07/16/2019 07/16/19 | For Rent | $1,850 | +2.8% | -- | |
| 08/15/2018 08/15/18 | Rented | $1,800 | 0.0% | -- | |
| 07/31/2018 07/31/18 | Price Changed | $1,800 | -2.7% | $2 / Sq Ft | |
| 07/15/2018 07/15/18 | For Rent | $1,850 | 0.0% | -- | |
| 04/30/2018 04/30/18 | Sold | $217,500 | -3.3% | $207 / Sq Ft | View Prior Sale |
| 03/07/2018 03/07/18 | Pending | -- | -- | -- | |
| 02/19/2018 02/19/18 | For Sale | $225,000 | -- | $214 / Sq Ft |
| Year | Tax Paid | Tax Assessment Tax Assessment Total Assessment is a certain percentage of the fair market value that is determined by local assessors to be the total taxable value of land and additions on the property. | Land | Improvement |
|---|---|---|---|---|
| 2025 | $4,020 | $322,100 | $0 | $322,100 |
| 2024 | $3,958 | $296,500 | $0 | $296,500 |
| 2023 | $3,865 | $264,900 | $0 | $264,900 |
| 2022 | $3,647 | $237,000 | $0 | $237,000 |
| 2021 | $3,598 | $232,400 | $0 | $232,400 |
| 2020 | $3,394 | $220,700 | $0 | $220,700 |
| 2019 | $3,454 | $216,400 | $0 | $216,400 |
| 2018 | $3,018 | $186,700 | $0 | $186,700 |
| 2017 | $2,821 | $173,900 | $0 | $173,900 |
| 2016 | $2,607 | $161,000 | $0 | $161,000 |
| 2015 | $2,814 | $167,700 | $0 | $167,700 |
| 2014 | $2,792 | $167,700 | $0 | $167,700 |
Landlord's Agent in 2023
Mike Huang
Lewis & Joyce Real Estate
(781) 888-8133
4 in this area
103 Total Sales
Tenant's Agent in 2023
Sandy Santoro
Dream Realty
(508) 954-3195
5 in this area
38 Total Sales
J
Seller's Agent in 2019
Joseph Chan
Keller Williams Realty
Seller's Agent in 2018
Lori Saville
Coldwell Banker Realty - Easton
(508) 380-9672
5 in this area
83 Total Sales
Source: MLS Property Information Network (MLS PIN)
MLS Number: 73092298
APN: EAST-000040U-000240
Disclaimer: Certain information contained herein is derived from information provided by parties other than Homes.com. All information provided is deemed reliable, but is not guaranteed to be accurate and should be independently verified.
![]() The property listing data and information, or the Images, set forth herein were provided to MLS Property Information Network, Inc. from third party sources, including sellers, lessors and public records, and were compiled by MLS Property Information Network, Inc. The property listing data and information, and the Images, are for the personal, non-commercial use of consumers having a good faith interest in purchasing or leasing listed properties of the type displayed to them and may not be used for any purpose other than to identify prospective properties which such consumers may have a good faith interest in purchasing or leasing. MLS Property Information Network, Inc. and its subscribers disclaim any and all representations and warranties as to the accuracy of the property listing data and information, or as to the accuracy of any of the Images, set forth herein.
The property listing data and information, or the Images, set forth herein were provided to MLS Property Information Network, Inc. from third party sources, including sellers, lessors and public records, and were compiled by MLS Property Information Network, Inc. The property listing data and information, and the Images, are for the personal, non-commercial use of consumers having a good faith interest in purchasing or leasing listed properties of the type displayed to them and may not be used for any purpose other than to identify prospective properties which such consumers may have a good faith interest in purchasing or leasing. MLS Property Information Network, Inc. and its subscribers disclaim any and all representations and warranties as to the accuracy of the property listing data and information, or as to the accuracy of any of the Images, set forth herein.