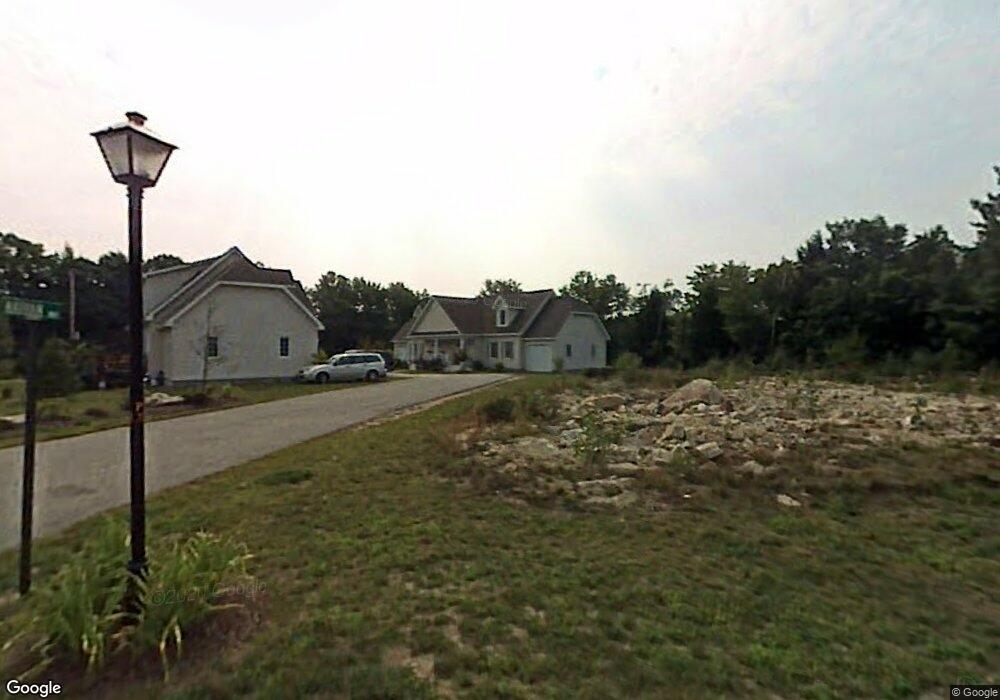
7 Nathan Way Topsham, ME 04086
Estimated Value: $397,000 - $414,000
3
Beds
2
Baths
1,386
Sq Ft
$294/Sq Ft
Est. Value
About This Home
This home is located at 7 Nathan Way, Topsham, ME 04086 and is currently estimated at $407,267, approximately $293 per square foot. 7 Nathan Way is a home located in Sagadahoc County with nearby schools including Mt Ararat High School and St. John's Catholic School.
Ownership History
Date
Name
Owned For
Owner Type
Purchase Details
Closed on
Oct 3, 2016
Sold by
Fallon John J and Fallon Joyce M
Bought by
Reichner Richard F and Reichner Linda J
Current Estimated Value
Home Financials for this Owner
Home Financials are based on the most recent Mortgage that was taken out on this home.
Original Mortgage
$144,600
Outstanding Balance
$64,205
Interest Rate
2.74%
Mortgage Type
New Conventional
Estimated Equity
$343,062
Purchase Details
Closed on
Jun 28, 2013
Sold by
Doucette Betty A
Bought by
Fallon John J and Fallon Joyce M
Home Financials for this Owner
Home Financials are based on the most recent Mortgage that was taken out on this home.
Original Mortgage
$153,600
Interest Rate
3.51%
Mortgage Type
New Conventional
Purchase Details
Closed on
Jul 19, 2005
Sold by
Marut Michele R
Bought by
Doucette Betty A
Create a Home Valuation Report for This Property
The Home Valuation Report is an in-depth analysis detailing your home's value as well as a comparison with similar homes in the area
Home Values in the Area
Average Home Value in this Area
Purchase History
| Date | Buyer | Sale Price | Title Company |
|---|---|---|---|
| Reichner Richard F | -- | -- | |
| Reichner Richard F | -- | -- | |
| Fallon John J | -- | -- | |
| Doucette Betty A | -- | -- |
Source: Public Records
Mortgage History
| Date | Status | Borrower | Loan Amount |
|---|---|---|---|
| Open | Reichner Richard F | $144,600 | |
| Closed | Reichner Richard F | $144,600 | |
| Previous Owner | Fallon John J | $153,600 |
Source: Public Records
Tax History Compared to Growth
Tax History
| Year | Tax Paid | Tax Assessment Tax Assessment Total Assessment is a certain percentage of the fair market value that is determined by local assessors to be the total taxable value of land and additions on the property. | Land | Improvement |
|---|---|---|---|---|
| 2025 | $4,609 | $360,100 | $70,000 | $290,100 |
| 2024 | $3,933 | $314,600 | $55,000 | $259,600 |
| 2023 | $4,103 | $302,100 | $55,000 | $247,100 |
| 2022 | $3,689 | $255,800 | $55,000 | $200,800 |
| 2021 | $3,936 | $248,000 | $55,000 | $193,000 |
| 2020 | $4,154 | $232,600 | $55,000 | $177,600 |
| 2019 | $4,159 | $217,200 | $55,000 | $162,200 |
| 2018 | $3,933 | $210,000 | $55,000 | $155,000 |
| 2017 | $3,805 | $210,000 | $55,000 | $155,000 |
| 2016 | $3,566 | $198,200 | $55,000 | $143,200 |
| 2015 | $3,454 | $192,300 | $55,000 | $137,300 |
| 2014 | $3,256 | $187,900 | $55,000 | $132,900 |
| 2013 | $2,980 | $179,000 | $55,000 | $124,000 |
Source: Public Records
Map
Nearby Homes
- 9 Nathan Way
- 9 Nathan Way Unit 3
- 7 Nathan Way Unit 4
- 6 Nathan Way
- 6 Nathan Way Unit 6
- 8 Nathan Way
- 8 Nathan Way Unit 8
- 8 Nathan Way Unit 5
- 15 Hannah Dr
- 15 Hannah Dr Unit 7
- 15 Chad Dr
- 17 Hannah Dr
- 17 Hannah Dr Unit 17
- 3 Nathan Dr
- 20 Anthony Ave
- 18 Anthony Ave
- 22 Patricia Dr
- 20 Patricia Dr
- 5 Nathan Dr
- 14 Hannah Dr