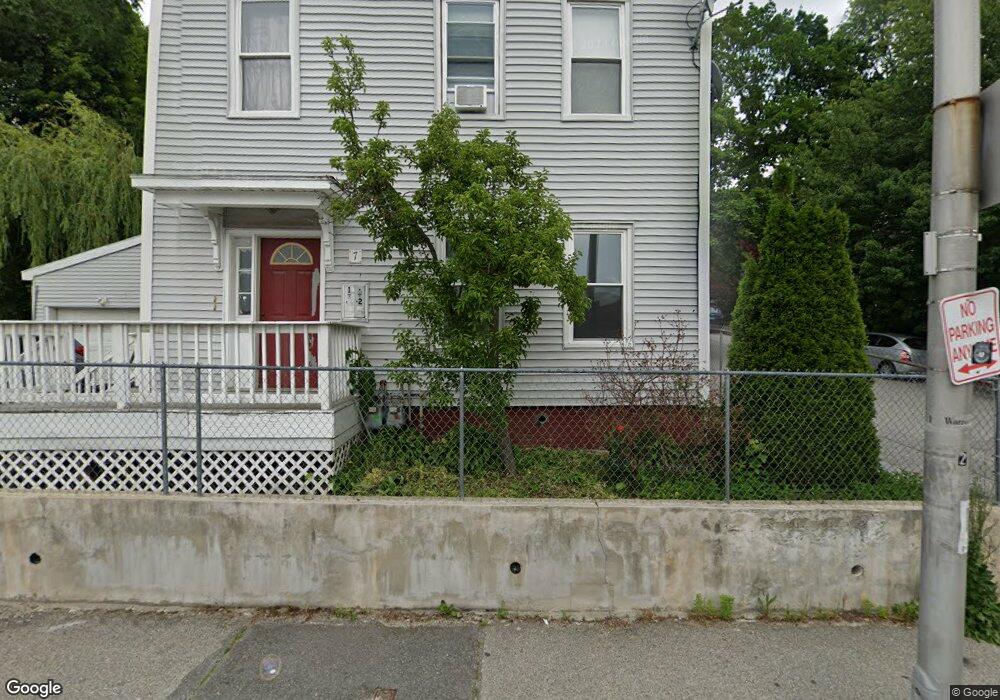
7 Newbury St Worcester, MA 01609
Elm Park NeighborhoodEstimated Value: $441,682 - $565,000
4
Beds
2
Baths
2,604
Sq Ft
$201/Sq Ft
Est. Value
About This Home
This home is located at 7 Newbury St, Worcester, MA 01609 and is currently estimated at $524,421, approximately $201 per square foot. 7 Newbury St is a home located in Worcester County with nearby schools including Jacob Hiatt Magnet School, Chandler Magnet, and Elm Park Elementary School.
Ownership History
Date
Name
Owned For
Owner Type
Purchase Details
Closed on
Oct 23, 2007
Sold by
Pinto Benigno A and Pinto Luz E
Bought by
Rodriguez Wandy
Current Estimated Value
Home Financials for this Owner
Home Financials are based on the most recent Mortgage that was taken out on this home.
Original Mortgage
$49,804
Outstanding Balance
$31,579
Interest Rate
6.51%
Mortgage Type
Purchase Money Mortgage
Estimated Equity
$492,842
Purchase Details
Closed on
Dec 22, 1998
Sold by
Worcester Common Groun
Bought by
Pinto Luz E and Pinto Benigno A
Home Financials for this Owner
Home Financials are based on the most recent Mortgage that was taken out on this home.
Original Mortgage
$55,100
Interest Rate
6.89%
Purchase Details
Closed on
Mar 10, 1997
Sold by
Smothers Tolbert
Bought by
Worc Common Ground Inc
Create a Home Valuation Report for This Property
The Home Valuation Report is an in-depth analysis detailing your home's value as well as a comparison with similar homes in the area
Home Values in the Area
Average Home Value in this Area
Purchase History
| Date | Buyer | Sale Price | Title Company |
|---|---|---|---|
| Rodriguez Wandy | $71,964 | -- | |
| Pinto Luz E | $58,000 | -- | |
| Worc Common Ground Inc | $2,000 | -- |
Source: Public Records
Mortgage History
| Date | Status | Borrower | Loan Amount |
|---|---|---|---|
| Open | Rodriguez Wandy | $49,804 | |
| Previous Owner | Worc Common Ground Inc | $55,100 | |
| Previous Owner | Worc Common Ground Inc | $55,100 | |
| Previous Owner | Worc Common Ground Inc | $20,000 | |
| Previous Owner | Worc Common Ground Inc | $57,996 |
Source: Public Records
Tax History Compared to Growth
Tax History
| Year | Tax Paid | Tax Assessment Tax Assessment Total Assessment is a certain percentage of the fair market value that is determined by local assessors to be the total taxable value of land and additions on the property. | Land | Improvement |
|---|---|---|---|---|
| 2025 | $5,578 | $422,900 | $36,400 | $386,500 |
| 2024 | $5,221 | $379,700 | $36,400 | $343,300 |
| 2023 | $4,858 | $338,800 | $28,800 | $310,000 |
| 2022 | $4,530 | $297,800 | $23,000 | $274,800 |
| 2021 | $4,164 | $255,800 | $18,400 | $237,400 |
| 2020 | $3,832 | $225,400 | $18,400 | $207,000 |
| 2019 | $3,895 | $216,400 | $17,500 | $198,900 |
| 2018 | $3,761 | $198,900 | $17,500 | $181,400 |
| 2017 | $3,538 | $184,100 | $17,500 | $166,600 |
| 2016 | $3,343 | $162,200 | $12,900 | $149,300 |
| 2015 | $3,255 | $162,200 | $12,900 | $149,300 |
| 2014 | $3,169 | $162,200 | $12,900 | $149,300 |
Source: Public Records
Map
Nearby Homes
- 80 Chatham St
- 230 Pleasant St
- 111 Austin St
- 13 West St
- 93 Austin St
- 146 -152 Chandler
- 58 Elm St Unit 11
- 56 Elm St Unit 1
- 58 Elm St Unit 1
- 6 Pelham St
- 6 Chatham Place Unit 6
- 44 Elm St Unit 501
- 46 Townsend St
- 61 William St
- 32 Blossom St
- 42 William St
- 3 Marston Way
- 38 1/2 Bowdoin St
- 531 Main St Unit 503
- 531 Main St Unit 410
- 83 Congress St Unit 3
- 17 Congress St
- 19 Congress St
- 17 Congress St Unit 2
- 15 Congress St
- 14 Congress St
- 14 Congress St Unit 1,14
- 244 Pleasant St
- 244 Pleasant St Unit 1R
- 244 - 250 Pleasant St
- 260 Pleasant St
- 15 Newbury St
- 242 Pleasant St Unit C2
- 242 Pleasant St Unit C1
- 242 Pleasant St
- 242 Pleasant St Unit 1L
- 13 Congress St
- 270 Pleasant St
- 272 Pleasant St
- 234 Pleasant St Unit 3