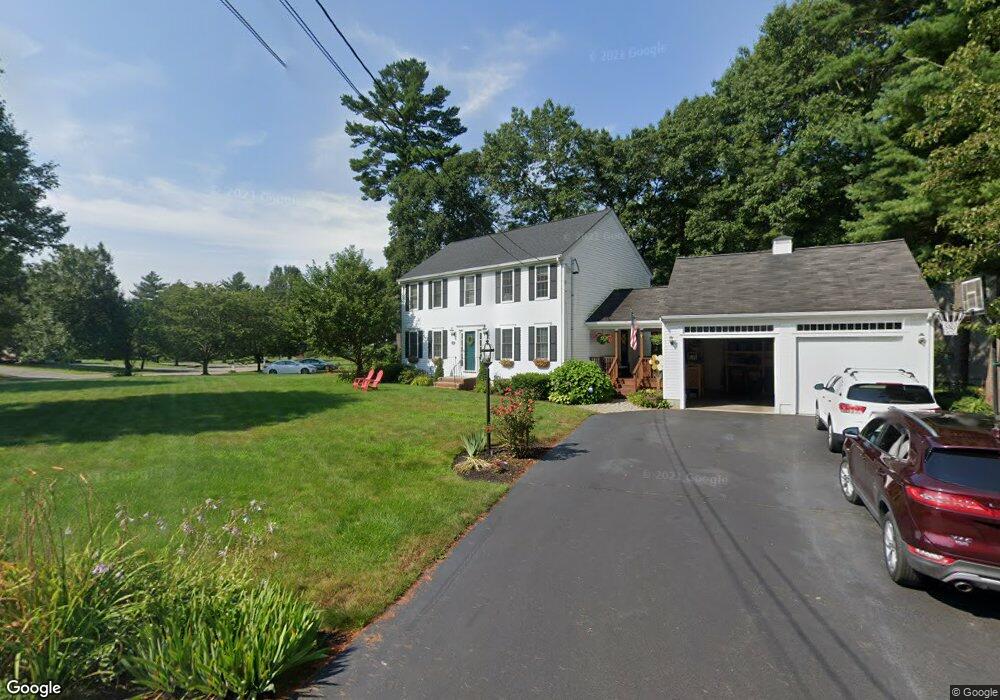
7 Nicholas Way Middleboro, MA 02346
Estimated Value: $692,000 - $734,000
4
Beds
3
Baths
2,340
Sq Ft
$304/Sq Ft
Est. Value
About This Home
This home is located at 7 Nicholas Way, Middleboro, MA 02346 and is currently estimated at $711,831, approximately $304 per square foot. 7 Nicholas Way is a home located in Plymouth County with nearby schools including Mary K. Goode Elementary School, Mullein Hill Christian Academy, and Chamberlain International School.
Ownership History
Date
Name
Owned For
Owner Type
Purchase Details
Closed on
Apr 16, 2002
Sold by
Cmg Dev Inc
Bought by
Labree Brian J and Labrees Nicole J
Current Estimated Value
Create a Home Valuation Report for This Property
The Home Valuation Report is an in-depth analysis detailing your home's value as well as a comparison with similar homes in the area
Home Values in the Area
Average Home Value in this Area
Purchase History
| Date | Buyer | Sale Price | Title Company |
|---|---|---|---|
| Labree Brian J | $267,000 | -- |
Source: Public Records
Mortgage History
| Date | Status | Borrower | Loan Amount |
|---|---|---|---|
| Open | Labree Brian J | $205,000 | |
| Closed | Labree Brian J | $45,000 |
Source: Public Records
Tax History Compared to Growth
Tax History
| Year | Tax Paid | Tax Assessment Tax Assessment Total Assessment is a certain percentage of the fair market value that is determined by local assessors to be the total taxable value of land and additions on the property. | Land | Improvement |
|---|---|---|---|---|
| 2025 | $8,750 | $652,500 | $175,200 | $477,300 |
| 2024 | $8,748 | $646,100 | $167,000 | $479,100 |
| 2023 | $7,923 | $556,400 | $167,000 | $389,400 |
| 2022 | $6,924 | $450,200 | $145,200 | $305,000 |
| 2021 | $6,409 | $393,900 | $133,500 | $260,400 |
| 2020 | $6,031 | $379,800 | $133,500 | $246,300 |
| 2019 | $5,879 | $379,800 | $133,500 | $246,300 |
| 2018 | $5,396 | $345,900 | $121,300 | $224,600 |
| 2017 | $4,969 | $315,100 | $116,900 | $198,200 |
| 2016 | $4,806 | $301,900 | $106,900 | $195,000 |
| 2015 | $4,597 | $291,300 | $106,300 | $185,000 |
Source: Public Records
Map
Nearby Homes
- 25 Hillside Ave
- 3 Old Field Way Unit 3
- 66 Forest St
- 48 Cross St
- 27 Pearl St
- 9 Taunton St
- 23 Taunton St
- 12 Surrey Dr
- 93 Peirce St
- 18 Rock St
- 0 Wareham Miller St Unit 73410845
- 194 Bedford St
- 6 Barrows St
- 21 Wareham St
- 39 Riverside Dr Unit 39
- 240 N Main St
- 1 Landing Way Unit 1
- 3 Corinne Pkwy
- 246 Everett St
- 19 Leonard St