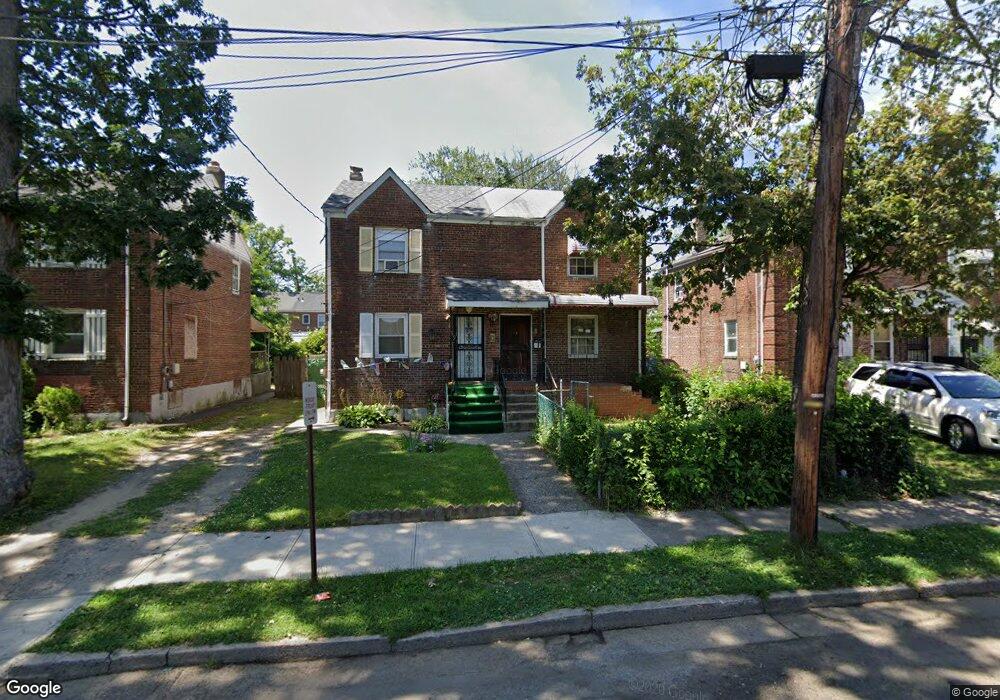
7 Nordacs Place Trenton, NJ 08618
Prospect NeighborhoodEstimated Value: $132,271 - $175,000
--
Bed
--
Bath
972
Sq Ft
$156/Sq Ft
Est. Value
About This Home
This home is located at 7 Nordacs Place, Trenton, NJ 08618 and is currently estimated at $152,068, approximately $156 per square foot. 7 Nordacs Place is a home located in Mercer County with nearby schools including Jefferson Elementary School, Joyce Kilmer Middle School, and Trenton Central High School - Main Campus.
Ownership History
Date
Name
Owned For
Owner Type
Purchase Details
Closed on
Sep 24, 2022
Sold by
Chateau Apartments Llc
Bought by
Schorr Sarah
Current Estimated Value
Home Financials for this Owner
Home Financials are based on the most recent Mortgage that was taken out on this home.
Original Mortgage
$99,750
Outstanding Balance
$95,604
Interest Rate
5.66%
Mortgage Type
New Conventional
Estimated Equity
$56,464
Purchase Details
Closed on
Feb 24, 2022
Sold by
Christine Adams Madelyne and Terrell Lenis
Bought by
Chateau Apartments Llc
Purchase Details
Closed on
Jan 10, 1996
Sold by
Peters Mary L
Bought by
Adam Madelyne and Adam Christine
Home Financials for this Owner
Home Financials are based on the most recent Mortgage that was taken out on this home.
Original Mortgage
$47,000
Interest Rate
7.31%
Create a Home Valuation Report for This Property
The Home Valuation Report is an in-depth analysis detailing your home's value as well as a comparison with similar homes in the area
Home Values in the Area
Average Home Value in this Area
Purchase History
| Date | Buyer | Sale Price | Title Company |
|---|---|---|---|
| Schorr Sarah | -- | Universal Title | |
| Schorr Sarah | -- | Universal Title | |
| Chateau Apartments Llc | $20,000 | Zimnis Peter E | |
| Chateau Apartments Llc | $20,000 | None Listed On Document | |
| Adam Madelyne | $47,950 | -- |
Source: Public Records
Mortgage History
| Date | Status | Borrower | Loan Amount |
|---|---|---|---|
| Open | Schorr Sarah | $99,750 | |
| Closed | Schorr Sarah | $99,750 | |
| Previous Owner | Adam Madelyne | $47,000 |
Source: Public Records
Tax History Compared to Growth
Tax History
| Year | Tax Paid | Tax Assessment Tax Assessment Total Assessment is a certain percentage of the fair market value that is determined by local assessors to be the total taxable value of land and additions on the property. | Land | Improvement |
|---|---|---|---|---|
| 2025 | $2,460 | $42,400 | $14,100 | $28,300 |
| 2024 | $2,360 | $42,400 | $14,100 | $28,300 |
| 2023 | $2,360 | $42,400 | $14,100 | $28,300 |
| 2022 | $2,314 | $42,400 | $14,100 | $28,300 |
| 2021 | $2,354 | $42,400 | $14,100 | $28,300 |
| 2020 | $2,347 | $42,400 | $14,100 | $28,300 |
| 2019 | $2,309 | $42,400 | $14,100 | $28,300 |
| 2018 | $2,633 | $50,500 | $14,100 | $36,400 |
| 2017 | $2,502 | $50,500 | $14,100 | $36,400 |
| 2016 | $2,738 | $47,600 | $17,200 | $30,400 |
| 2015 | $2,729 | $47,600 | $17,200 | $30,400 |
| 2014 | $2,716 | $47,600 | $17,200 | $30,400 |
Source: Public Records
Map
Nearby Homes
- 116 Oliver Ave
- 31 Bryn Mawr Ave
- 221 Highland Ave
- 22 Bryn Mawr Ave
- 840 Parkside Ave
- 23 Cadwalader Terrace
- 803 Pennington Ave
- 840-AFT Parkside Ave
- 865 Parkside Ave
- 46 Reading Ave
- 34 Arlington Ave
- 252 Parkway Ave
- 10 Whittier Ave
- 181 Rosemont Ave
- 58 Hayes Ave
- 2 Mccarthy Dr
- 60 Hayes Ave
- 62 Hayes Ave
- 503 N Hermitage Ave
- 318 Gardner Ave
- 9 Nordacs Place
- 5 Nordacs Place
- 11 Nordacs Place
- 3 Nordacs Place
- 13 Nordacs Place
- 1 Nordacs Place
- 15 Nordacs Place
- 330 Brinton Ave
- 332 Brinton Ave
- 328 Brinton Ave
- 326 Brinton Ave
- 334 Brinton Ave
- 17 Nordacs Place
- 336 Brinton Ave
- 324 Brinton Ave
- 322 Brinton Ave
- 19 Nordacs Place
- 8 Nordacs Place
- 6 Nordacs Place
- 10 Nordacs Place