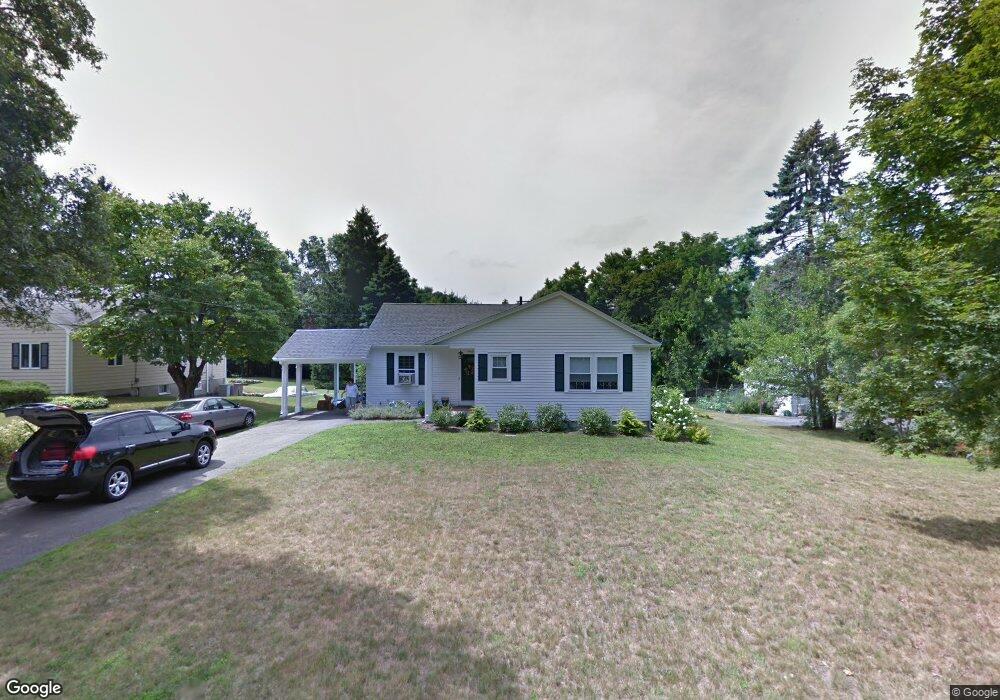
7 North St Unit 1 Lexington, MA 02420
North Lexington NeighborhoodEstimated Value: $1,038,929 - $1,301,000
3
Beds
1
Bath
1,178
Sq Ft
$1,007/Sq Ft
Est. Value
About This Home
This home is located at 7 North St Unit 1, Lexington, MA 02420 and is currently estimated at $1,186,732, approximately $1,007 per square foot. 7 North St Unit 1 is a home located in Middlesex County with nearby schools including Joseph Estabrook Elementary School, William Diamond Middle School, and Lexington High School.
Ownership History
Date
Name
Owned For
Owner Type
Purchase Details
Closed on
Oct 8, 2014
Sold by
Jenkinson David M and Jenkinson Jeannie M
Bought by
Chen Max J and Huang Irene X
Current Estimated Value
Home Financials for this Owner
Home Financials are based on the most recent Mortgage that was taken out on this home.
Original Mortgage
$300,000
Outstanding Balance
$100,641
Interest Rate
4.1%
Mortgage Type
New Conventional
Estimated Equity
$1,086,091
Purchase Details
Closed on
Nov 25, 2009
Sold by
Ruth E Hayes Rt
Bought by
Jenkinson David M and Jenkinson Jeannie M
Purchase Details
Closed on
Jul 24, 2009
Sold by
Hayes Ruth E
Bought by
Ruth E Hayes Rt
Create a Home Valuation Report for This Property
The Home Valuation Report is an in-depth analysis detailing your home's value as well as a comparison with similar homes in the area
Home Values in the Area
Average Home Value in this Area
Purchase History
| Date | Buyer | Sale Price | Title Company |
|---|---|---|---|
| Chen Max J | $643,500 | -- | |
| Jenkinson David M | $350,000 | -- | |
| Ruth E Hayes Rt | -- | -- |
Source: Public Records
Mortgage History
| Date | Status | Borrower | Loan Amount |
|---|---|---|---|
| Open | Chen Max J | $300,000 |
Source: Public Records
Tax History Compared to Growth
Tax History
| Year | Tax Paid | Tax Assessment Tax Assessment Total Assessment is a certain percentage of the fair market value that is determined by local assessors to be the total taxable value of land and additions on the property. | Land | Improvement |
|---|---|---|---|---|
| 2025 | $11,643 | $952,000 | $661,000 | $291,000 |
| 2024 | $11,258 | $919,000 | $629,000 | $290,000 |
| 2023 | $10,946 | $842,000 | $572,000 | $270,000 |
| 2022 | $10,419 | $755,000 | $520,000 | $235,000 |
| 2021 | $10,217 | $710,000 | $495,000 | $215,000 |
| 2020 | $9,821 | $699,000 | $495,000 | $204,000 |
| 2019 | $9,347 | $662,000 | $472,000 | $190,000 |
| 2018 | $6,907 | $627,000 | $449,000 | $178,000 |
| 2017 | $8,042 | $555,000 | $414,000 | $141,000 |
| 2016 | $8,015 | $549,000 | $394,000 | $155,000 |
| 2015 | $7,906 | $532,000 | $359,000 | $173,000 |
| 2014 | $6,452 | $416,000 | $319,000 | $97,000 |
Source: Public Records
Map
Nearby Homes
- 125 Burlington St
- 10 Partridge Rd
- 115 Burlington St
- 101 Burlington St
- 7 Henderson Rd
- 93 Adams St
- 3a Nowers Rd
- 42 Seven Springs Ln Unit A
- 665 Lowell St Unit 58
- 22 Burlington St
- 10 Preston Rd
- 3 Brown Rd
- 44 Simonds Rd
- 17 Hamilton Rd
- 23 Burroughs Rd
- 36 Adams St
- 10 Dewey Rd
- 23 Thoreau Rd
- 12 Coolidge Ave
- 49 Eldred St