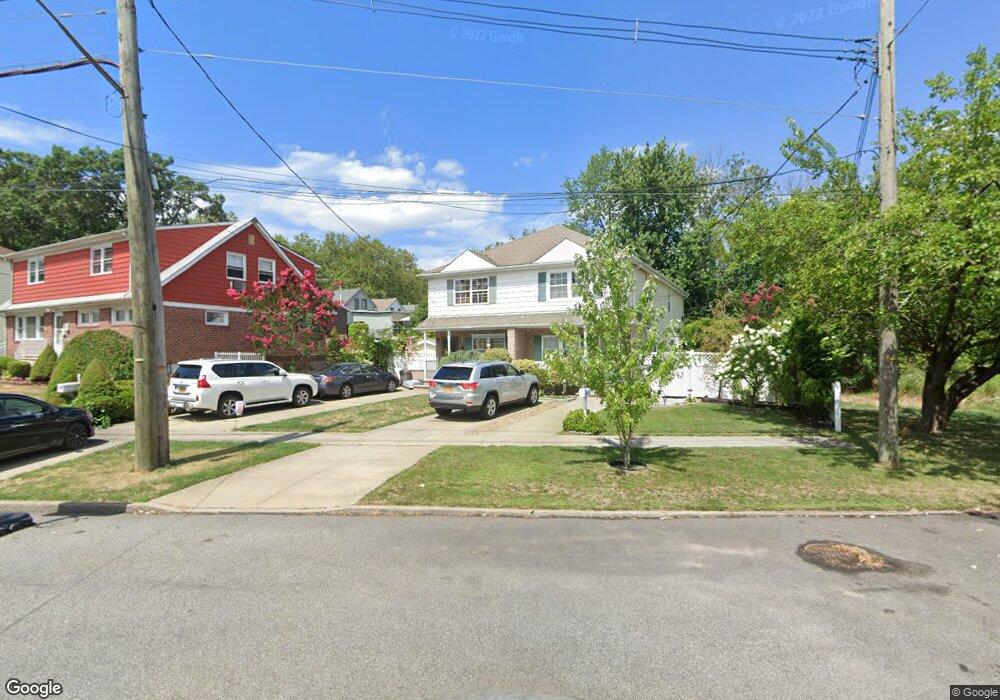
7 Northern Blvd Staten Island, NY 10301
Sunnyside NeighborhoodEstimated Value: $693,000 - $821,000
3
Beds
2
Baths
1,700
Sq Ft
$443/Sq Ft
Est. Value
About This Home
This home is located at 7 Northern Blvd, Staten Island, NY 10301 and is currently estimated at $753,549, approximately $443 per square foot. 7 Northern Blvd is a home located in Richmond County with nearby schools including P.S. 35 The Clove Valley School, Intermediate School 27, and Curtis High School.
Ownership History
Date
Name
Owned For
Owner Type
Purchase Details
Closed on
Jul 16, 2018
Sold by
Crawford Allyn J
Bought by
Fayad Khaled
Current Estimated Value
Home Financials for this Owner
Home Financials are based on the most recent Mortgage that was taken out on this home.
Original Mortgage
$414,000
Outstanding Balance
$358,793
Interest Rate
4.5%
Mortgage Type
New Conventional
Estimated Equity
$394,756
Purchase Details
Closed on
Jul 13, 2005
Sold by
Colasuonno Michael and Colasuonno Theresa
Bought by
Ziemkowski Arkadiusz and Ziemkowski Anna
Home Financials for this Owner
Home Financials are based on the most recent Mortgage that was taken out on this home.
Original Mortgage
$373,580
Interest Rate
5.81%
Mortgage Type
Fannie Mae Freddie Mac
Purchase Details
Closed on
May 6, 1998
Sold by
Lynja Development Corp
Bought by
Colasuonno Michael and Colasuonno Theresa
Create a Home Valuation Report for This Property
The Home Valuation Report is an in-depth analysis detailing your home's value as well as a comparison with similar homes in the area
Home Values in the Area
Average Home Value in this Area
Purchase History
| Date | Buyer | Sale Price | Title Company |
|---|---|---|---|
| Fayad Khaled | $464,600 | Ridge Abstract Corp | |
| Ziemkowski Arkadiusz | $415,090 | Prestige Title Agency Inc | |
| Colasuonno Michael | -- | -- |
Source: Public Records
Mortgage History
| Date | Status | Borrower | Loan Amount |
|---|---|---|---|
| Open | Fayad Khaled | $414,000 | |
| Previous Owner | Ziemkowski Arkadiusz | $373,580 |
Source: Public Records
Tax History Compared to Growth
Tax History
| Year | Tax Paid | Tax Assessment Tax Assessment Total Assessment is a certain percentage of the fair market value that is determined by local assessors to be the total taxable value of land and additions on the property. | Land | Improvement |
|---|---|---|---|---|
| 2025 | $6,298 | $39,720 | $10,996 | $28,724 |
| 2024 | $6,298 | $32,460 | $13,099 | $19,361 |
| 2023 | $6,008 | $29,582 | $11,448 | $18,134 |
| 2022 | $5,905 | $34,740 | $13,560 | $21,180 |
| 2021 | $5,988 | $36,600 | $13,560 | $23,040 |
| 2020 | $5,682 | $31,560 | $13,560 | $18,000 |
| 2019 | $5,466 | $33,720 | $13,560 | $20,160 |
| 2018 | $5,025 | $24,652 | $8,678 | $15,974 |
| 2017 | $5,025 | $24,652 | $11,393 | $13,259 |
| 2016 | $4,740 | $23,709 | $11,623 | $12,086 |
| 2015 | $4,179 | $22,368 | $12,877 | $9,491 |
| 2014 | $4,179 | $21,776 | $14,653 | $7,123 |
Source: Public Records
Map
Nearby Homes
- 19 Renwick Ave
- 35 Cypress Ave
- 98 Logan Ave
- 18 Dobbs Place
- 150 Dudley Ave
- 1197 Clove Rd
- 1380 Clove Rd
- 1384 Clove Rd
- 1386 Clove Rd
- 125 Tioga St
- 1428 Victory Blvd
- 159 Seneca Ave
- 144 Beverly Ave
- 0 Clove Rd
- 346 Little Clove Rd
- 86 Tioga St
- 124 van Cortlandt Ave
- 1100 Clove Rd Unit 2N
- 1100 Clove Rd Unit 6D
- 1100 Clove Rd Unit G0
- 3 Northern Blvd
- 15 Northern Blvd
- 23 Labau Ave
- 5 Northern Blvd
- 29 Labau Ave
- 21 Northern Blvd
- 21 Labau Ave
- 19 Labau Ave
- 25 Northern Blvd
- 12 Logan Ave
- 15 Labau Ave
- 6 Northern Blvd
- 1288 Victory Blvd
- 12 Northern Blvd
- 1298 Victory Blvd
- 26 Labau Ave
- 36 Labau Ave
- 44 Labau Ave
- 18 Northern Blvd
- 1300 Victory Blvd