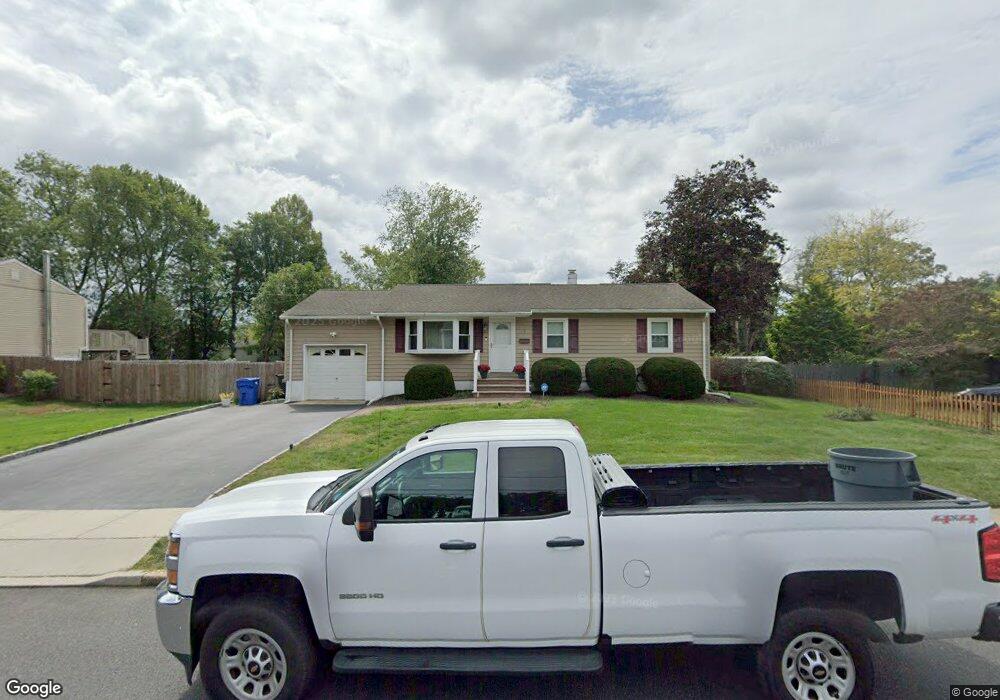
7 Nottingham Dr Howell, NJ 07731
Salem Hill NeighborhoodEstimated Value: $531,830 - $612,000
3
Beds
2
Baths
1,008
Sq Ft
$555/Sq Ft
Est. Value
About This Home
This home is located at 7 Nottingham Dr, Howell, NJ 07731 and is currently estimated at $558,958, approximately $554 per square foot. 7 Nottingham Dr is a home located in Monmouth County with nearby schools including Land O' Pines School, Newbury School, and Howell Middle School North.
Ownership History
Date
Name
Owned For
Owner Type
Purchase Details
Closed on
Jun 26, 2009
Sold by
Novik Michael
Bought by
Beckman Ryan and Pagdon Nicole
Current Estimated Value
Home Financials for this Owner
Home Financials are based on the most recent Mortgage that was taken out on this home.
Original Mortgage
$264,550
Outstanding Balance
$172,662
Interest Rate
5.31%
Mortgage Type
FHA
Estimated Equity
$386,296
Purchase Details
Closed on
Jun 22, 2007
Sold by
Mcmullan Robert
Bought by
Novik Michael
Purchase Details
Closed on
Oct 8, 2004
Sold by
Dowd Kevin
Bought by
Mcmullan Kevin
Home Financials for this Owner
Home Financials are based on the most recent Mortgage that was taken out on this home.
Original Mortgage
$265,000
Interest Rate
5.74%
Purchase Details
Closed on
Oct 28, 1994
Sold by
Scherer Christian
Bought by
Dowd Kevin and Dowd Maria
Home Financials for this Owner
Home Financials are based on the most recent Mortgage that was taken out on this home.
Original Mortgage
$111,000
Interest Rate
8.71%
Mortgage Type
FHA
Create a Home Valuation Report for This Property
The Home Valuation Report is an in-depth analysis detailing your home's value as well as a comparison with similar homes in the area
Home Values in the Area
Average Home Value in this Area
Purchase History
| Date | Buyer | Sale Price | Title Company |
|---|---|---|---|
| Beckman Ryan | $280,000 | None Available | |
| Novik Michael | $236,000 | None Available | |
| Mcmullan Kevin | $275,000 | -- | |
| Dowd Kevin | $113,000 | -- |
Source: Public Records
Mortgage History
| Date | Status | Borrower | Loan Amount |
|---|---|---|---|
| Open | Beckman Ryan | $264,550 | |
| Previous Owner | Mcmullan Kevin | $265,000 | |
| Previous Owner | Dowd Kevin | $111,000 |
Source: Public Records
Tax History Compared to Growth
Tax History
| Year | Tax Paid | Tax Assessment Tax Assessment Total Assessment is a certain percentage of the fair market value that is determined by local assessors to be the total taxable value of land and additions on the property. | Land | Improvement |
|---|---|---|---|---|
| 2025 | $7,811 | $501,900 | $360,800 | $141,100 |
| 2024 | $7,185 | $439,300 | $300,800 | $138,500 |
| 2023 | $7,185 | $386,100 | $250,800 | $135,300 |
| 2022 | $6,927 | $329,300 | $187,800 | $141,500 |
| 2021 | $6,927 | $301,700 | $175,800 | $125,900 |
| 2020 | $6,160 | $265,300 | $153,300 | $112,000 |
| 2019 | $6,014 | $254,200 | $144,100 | $110,100 |
| 2018 | $5,710 | $239,800 | $134,900 | $104,900 |
| 2017 | $5,659 | $235,000 | $133,300 | $101,700 |
| 2016 | $5,290 | $217,500 | $118,300 | $99,200 |
| 2015 | $5,260 | $214,100 | $117,500 | $96,600 |
| 2014 | $5,354 | $202,200 | $125,400 | $76,800 |
Source: Public Records
Map
Nearby Homes
- 19 Kensington Dr
- 20 Nottingham Dr
- 28 Princeton Dr
- 147 Newbury Rd
- 28 Salem Hill Rd
- 134 Darien Rd
- 47 Yellowstone Ln
- 45 Springhill Dr
- 307 Princeton Dr
- 85 Starlight Rd
- 9 Yellowstone Ln
- 24 Sun Hollow Rd
- 131 Starlight Rd
- 43 Darien Rd
- 324 Aldrich Rd
- 30 Forrest Hill Dr
- 51 Hedgewood Rd
- 7 Cherry Bend Dr
- 41 Sweetbriar Trail
- 4 Rainbow Dr
- 9 Nottingham Dr
- 5 Nottingham Dr
- 168 Newbury Rd
- 170 Newbury Rd
- 166 Newbury Rd
- 11 Nottingham Dr
- 6 Nottingham Dr
- 8 Nottingham Dr
- 18 Kensington Dr
- 4 Nottingham Dr
- 172 Newbury Rd
- 164 Newbury Rd
- 13 Nottingham Dr
- 16 Kensington Dr
- 15 Princeton Dr
- 162 Newbury Rd
- 13 Princeton Dr
- 17 Princeton Dr
- 15 Nottingham Dr
- 178 Newbury Rd