7 Oak Leaf Ct SW Cartersville, GA 30120
Estimated Value: $572,000 - $612,000
--
Bed
3
Baths
3,104
Sq Ft
$191/Sq Ft
Est. Value
About This Home
This home is located at 7 Oak Leaf Ct SW, Cartersville, GA 30120 and is currently estimated at $592,211, approximately $190 per square foot. 7 Oak Leaf Ct SW is a home located in Bartow County with nearby schools including Winegard Elementary School, Cartersville Elementary School, and Judson B Walker Middle School.
Ownership History
Date
Name
Owned For
Owner Type
Purchase Details
Closed on
Aug 28, 2014
Sold by
W B H Contracting Inc
Bought by
Morris Justin and Morris Laurie
Current Estimated Value
Home Financials for this Owner
Home Financials are based on the most recent Mortgage that was taken out on this home.
Original Mortgage
$251,655
Outstanding Balance
$193,014
Interest Rate
4.19%
Mortgage Type
New Conventional
Estimated Equity
$399,197
Purchase Details
Closed on
Mar 17, 2014
Sold by
Hix Kathryn L
Bought by
Wbh Contracting Inc
Purchase Details
Closed on
Sep 18, 2012
Sold by
Hamilton State Bank
Bought by
Bradford Sd Investments Llc
Purchase Details
Closed on
Sep 4, 2012
Sold by
Hamilton State Bank
Bought by
Bradford Sd Investments Llc
Purchase Details
Closed on
Aug 30, 2012
Sold by
Federal Deposit Insurance Corporation
Bought by
Hamilton State Bank
Create a Home Valuation Report for This Property
The Home Valuation Report is an in-depth analysis detailing your home's value as well as a comparison with similar homes in the area
Home Values in the Area
Average Home Value in this Area
Purchase History
| Date | Buyer | Sale Price | Title Company |
|---|---|---|---|
| Morris Justin | $264,900 | -- | |
| Wbh Contracting Inc | -- | -- | |
| Hix Kathryn L | -- | -- | |
| Bradford Sd Investments Llc | $427,000 | -- | |
| Hamilton State Bank | -- | -- | |
| Bradford Sd Investments Llc | $427,000 | -- | |
| Hamilton State Bank | -- | -- |
Source: Public Records
Mortgage History
| Date | Status | Borrower | Loan Amount |
|---|---|---|---|
| Open | Morris Justin | $251,655 |
Source: Public Records
Tax History Compared to Growth
Tax History
| Year | Tax Paid | Tax Assessment Tax Assessment Total Assessment is a certain percentage of the fair market value that is determined by local assessors to be the total taxable value of land and additions on the property. | Land | Improvement |
|---|---|---|---|---|
| 2024 | $6,279 | $255,033 | $28,600 | $226,433 |
| 2023 | $6,319 | $255,233 | $28,600 | $226,633 |
| 2022 | $4,941 | $190,356 | $22,000 | $168,356 |
| 2021 | $3,844 | $145,035 | $22,000 | $123,035 |
| 2020 | $3,986 | $143,035 | $20,000 | $123,035 |
| 2019 | $4,059 | $141,766 | $20,000 | $121,766 |
| 2018 | $3,579 | $124,317 | $14,400 | $109,917 |
| 2017 | $3,656 | $124,317 | $14,400 | $109,917 |
| 2016 | $3,646 | $122,000 | $16,000 | $106,000 |
| 2015 | $3,090 | $105,960 | $16,000 | $89,960 |
| 2014 | -- | $4,800 | $4,800 | $0 |
| 2013 | -- | $2,162 | $2,162 | $0 |
Source: Public Records
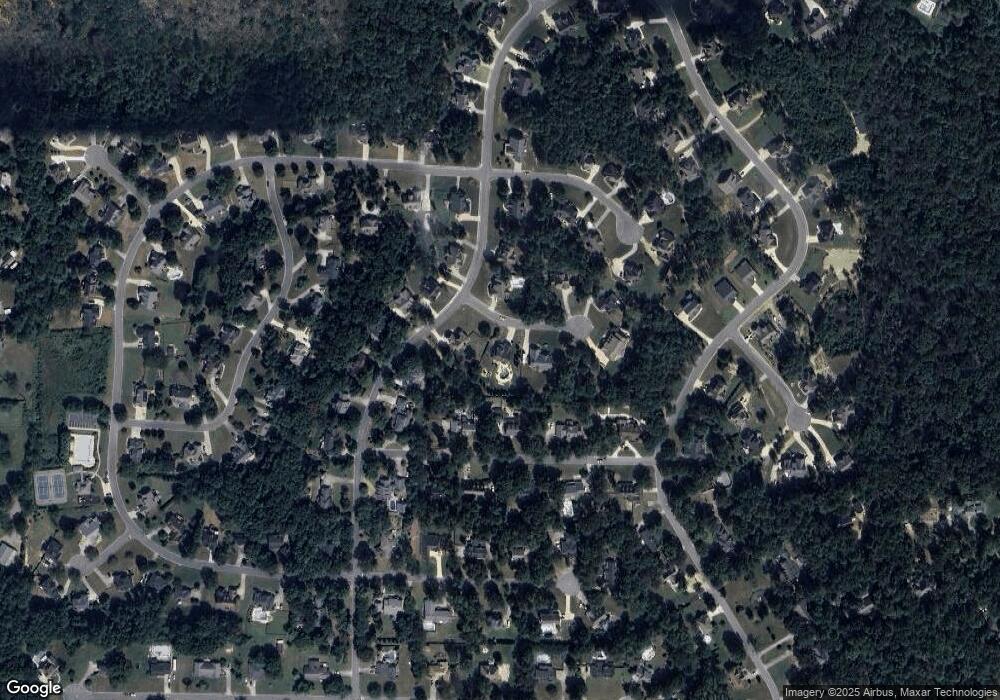
Map
Nearby Homes
- 11 Forest Hill Dr SW
- 10 Wood Forest Dr SW
- 20 Heartwood Dr SW
- 33 Heartwood Dr SW
- 79 Floyd Rd SW
- 0 Dodson Rd SW Unit 7678715
- 0 Dodson Rd SW Unit 10641452
- 28 Weems Spur SW
- 718 Sugar Valley Rd SW
- 1100 Sugar Valley Rd SW
- 19 Canefield Dr
- 28 Frances Way SW
- 49 Bramblewood Trail SW
- 14 Rubie Ln SW
- 17 Bramblewood Place SW
- 21 Wayne Dr SW
- 1042 Mission Rd SW
- 102 Burnt Hickory Tract 2 Rd
- 105 Garland Gable Dr Unit 3A
- 105 Garland Gable Dr
- 7 Oakleaf Ct SW
- 9 Oak Leaf Ct SW
- 5 Oak Leaf Ct SW Unit 204
- 5 Oak Leaf Ct SW
- 15 Forest Hill Dr SW
- 13 Forest Hill Dr SW
- 44 Mission Hills Dr SW
- 4 Oak Leaf Ct SW
- 4 Oak Leaf Ct SW
- 17 Forest Hill Dr SW
- 6 Oak Leaf Ct SW
- 6 Oak Leaf Ct
- 11 Forest Hill Dr SW
- 11 Forest Hill Dr SW
- 46 Mission Hills Dr SW
- 13 Oak Leaf Ct SW
- 51 Mission Hills Dr SW
- 12 Forest Hill Dr SW
- 49 Mission Hills Dr SW
- 8 Oak Leaf Ct SW