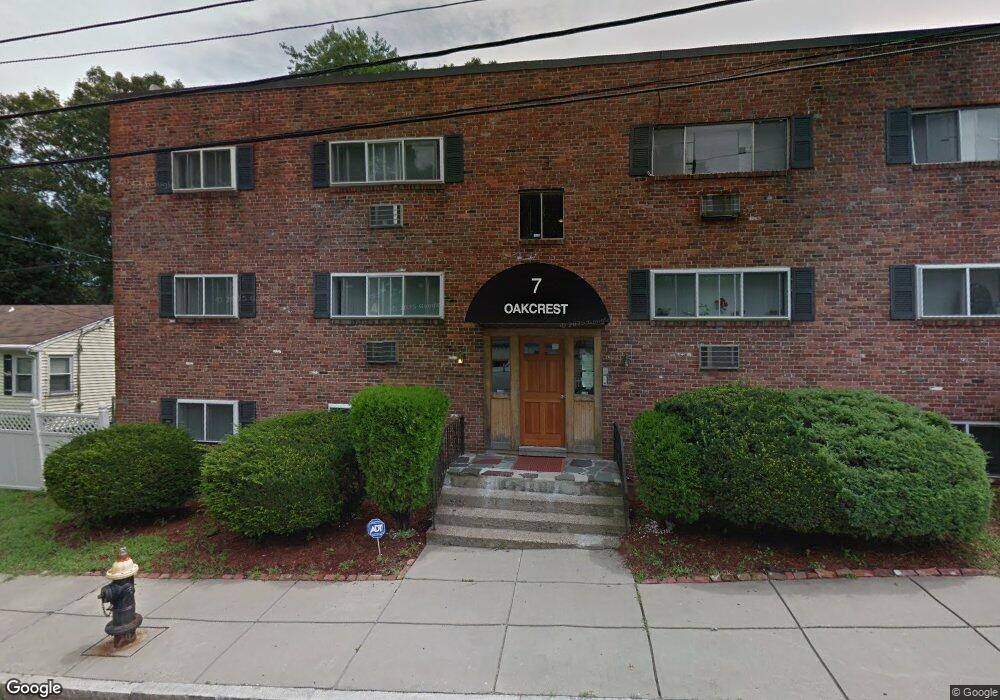
7 Oakcrest Rd Unit 3 Boston, MA 02136
Hyde Park NeighborhoodEstimated Value: $262,097 - $312,000
2
Beds
1
Bath
705
Sq Ft
$415/Sq Ft
Est. Value
About This Home
This home is located at 7 Oakcrest Rd Unit 3, Boston, MA 02136 and is currently estimated at $292,524, approximately $414 per square foot. 7 Oakcrest Rd Unit 3 is a home located in Suffolk County with nearby schools including KIPP Academy Boston Charter School and Boston Preparatory Charter Public School.
Ownership History
Date
Name
Owned For
Owner Type
Purchase Details
Closed on
Oct 14, 2021
Sold by
Queally Desmond J
Bought by
Desmond J Queally Ft
Current Estimated Value
Purchase Details
Closed on
Jan 27, 2011
Sold by
55 Devon Street Llc
Bought by
Boston City Of
Purchase Details
Closed on
Feb 1, 1994
Sold by
Dime Sb Ny
Bought by
Bossman Inc
Home Financials for this Owner
Home Financials are based on the most recent Mortgage that was taken out on this home.
Original Mortgage
$33,000
Interest Rate
7.11%
Mortgage Type
Purchase Money Mortgage
Purchase Details
Closed on
Jun 22, 1992
Sold by
Kaufman Fred
Bought by
Dime Sb Of Ny
Purchase Details
Closed on
Sep 21, 1987
Sold by
Oakcrest Trust
Bought by
Kaufman Fred
Home Financials for this Owner
Home Financials are based on the most recent Mortgage that was taken out on this home.
Original Mortgage
$54,000
Interest Rate
10.35%
Mortgage Type
Purchase Money Mortgage
Create a Home Valuation Report for This Property
The Home Valuation Report is an in-depth analysis detailing your home's value as well as a comparison with similar homes in the area
Home Values in the Area
Average Home Value in this Area
Purchase History
| Date | Buyer | Sale Price | Title Company |
|---|---|---|---|
| Desmond J Queally Ft | -- | None Available | |
| Boston City Of | $875 | -- | |
| Bossman Inc | $5,000 | -- | |
| Dime Sb Of Ny | $36,619 | -- | |
| Kaufman Fred | $67,500 | -- |
Source: Public Records
Mortgage History
| Date | Status | Borrower | Loan Amount |
|---|---|---|---|
| Previous Owner | Kaufman Fred | $33,000 | |
| Previous Owner | Kaufman Fred | $10,125 | |
| Previous Owner | Kaufman Fred | $54,000 |
Source: Public Records
Tax History
| Year | Tax Paid | Tax Assessment Tax Assessment Total Assessment is a certain percentage of the fair market value that is determined by local assessors to be the total taxable value of land and additions on the property. | Land | Improvement |
|---|---|---|---|---|
| 2025 | $2,475 | $213,700 | $0 | $213,700 |
| 2024 | $2,590 | $237,600 | $0 | $237,600 |
| 2023 | $2,476 | $230,500 | $0 | $230,500 |
| 2022 | $2,344 | $215,400 | $0 | $215,400 |
| 2021 | $2,131 | $199,700 | $0 | $199,700 |
| 2020 | $1,449 | $137,200 | $0 | $137,200 |
| 2019 | $1,314 | $124,700 | $0 | $124,700 |
| 2018 | $1,307 | $124,700 | $0 | $124,700 |
| 2017 | $1,245 | $117,600 | $0 | $117,600 |
| 2016 | $1,256 | $114,200 | $0 | $114,200 |
| 2015 | $1,272 | $105,000 | $0 | $105,000 |
| 2014 | -- | $101,900 | $0 | $101,900 |
Source: Public Records
Map
Nearby Homes
- 7 Winborough St
- 24 Belnel Rd
- 27 Ralwood Rd
- 23 Caton St
- 30 Massasoit St
- 645 River St
- 75-77 Belnel Rd
- 106 Lewiston St
- 52 Taunton Ave
- 640 River St
- 34 Ridlon Rd
- 16 Concord Ave Unit 1
- 0 Tina Ave
- 18 Rugby Rd
- 839-843 Cummins Hwy
- 82 Blue Hill Ave
- 19 Tacoma St
- 19 Melba Way
- 770 Cummins Hwy Unit 1
- 770 Cummins Hwy Unit 22
- 7 Oakcrest Rd
- 7 Oakcrest Rd Unit 2
- 19 Oakcrest Rd
- 25 Oakcrest Rd
- 7 Oakcrest Rd Unit 11
- 7 Oakcrest Rd Unit 10
- 7 Oakcrest Rd Unit 9
- 7 Oakcrest Rd Unit 8
- 7 Oakcrest Rd
- 7 Oakcrest Rd Unit 6
- 7 Oakcrest Rd Unit 5
- 7 Oakcrest Rd Unit 4
- 7 Oakcrest Rd Unit 3
- 7 Oakcrest Rd Unit 2
- 7 Oakcrest Rd Unit 1
- 7 Oakcrest Rd Unit 7
- 8 Oakcrest Rd
- 20 Oakcrest Rd
- 4 Oakcrest Rd Unit 31
- 4 Oakcrest Rd Unit 33
Your Personal Tour Guide
Ask me questions while you tour the home.