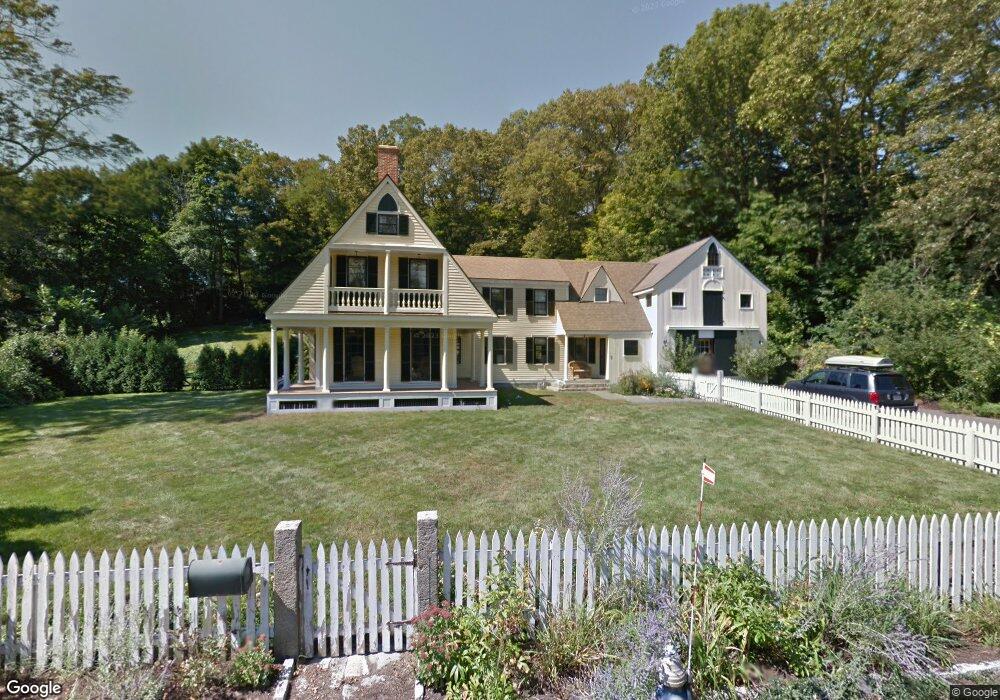
7 Oakland St Medway, MA 02053
Estimated Value: $701,000 - $796,000
3
Beds
3
Baths
2,643
Sq Ft
$284/Sq Ft
Est. Value
About This Home
This home is located at 7 Oakland St, Medway, MA 02053 and is currently estimated at $750,595, approximately $283 per square foot. 7 Oakland St is a home located in Norfolk County with nearby schools including John D. McGovern Elementary School, Burke-Memorial Elementary, and Medway Middle School.
Ownership History
Date
Name
Owned For
Owner Type
Purchase Details
Closed on
Nov 19, 1993
Sold by
Lee Kevin M and Lee Nancy M
Bought by
Durkin Helen A
Current Estimated Value
Home Financials for this Owner
Home Financials are based on the most recent Mortgage that was taken out on this home.
Original Mortgage
$157,500
Interest Rate
6.77%
Mortgage Type
Purchase Money Mortgage
Purchase Details
Closed on
Aug 29, 1991
Sold by
Covell John S
Bought by
Lee Kevin M and Lee Nancy M
Purchase Details
Closed on
Mar 27, 1987
Sold by
Covell John S
Bought by
Covell John S
Create a Home Valuation Report for This Property
The Home Valuation Report is an in-depth analysis detailing your home's value as well as a comparison with similar homes in the area
Home Values in the Area
Average Home Value in this Area
Purchase History
| Date | Buyer | Sale Price | Title Company |
|---|---|---|---|
| Durkin Helen A | $175,500 | -- | |
| Lee Kevin M | $181,700 | -- | |
| Covell John S | $204,000 | -- |
Source: Public Records
Mortgage History
| Date | Status | Borrower | Loan Amount |
|---|---|---|---|
| Open | Covell John S | $320,000 | |
| Closed | Covell John S | $24,500 | |
| Closed | Covell John S | $157,500 |
Source: Public Records
Tax History Compared to Growth
Tax History
| Year | Tax Paid | Tax Assessment Tax Assessment Total Assessment is a certain percentage of the fair market value that is determined by local assessors to be the total taxable value of land and additions on the property. | Land | Improvement |
|---|---|---|---|---|
| 2025 | $8,598 | $603,400 | $284,100 | $319,300 |
| 2024 | $8,689 | $603,400 | $284,100 | $319,300 |
| 2023 | $8,547 | $536,200 | $244,900 | $291,300 |
| 2022 | $8,472 | $500,400 | $218,800 | $281,600 |
| 2021 | $8,437 | $483,200 | $197,000 | $286,200 |
| 2020 | $8,225 | $470,000 | $175,200 | $294,800 |
| 2019 | $7,754 | $456,900 | $175,200 | $281,700 |
| 2018 | $7,850 | $444,500 | $153,500 | $291,000 |
| 2017 | $7,725 | $431,100 | $142,600 | $288,500 |
| 2016 | $7,315 | $403,900 | $147,400 | $256,500 |
| 2015 | $6,627 | $363,300 | $131,700 | $231,600 |
| 2014 | $6,472 | $343,500 | $141,400 | $202,100 |
Source: Public Records
Map
Nearby Homes