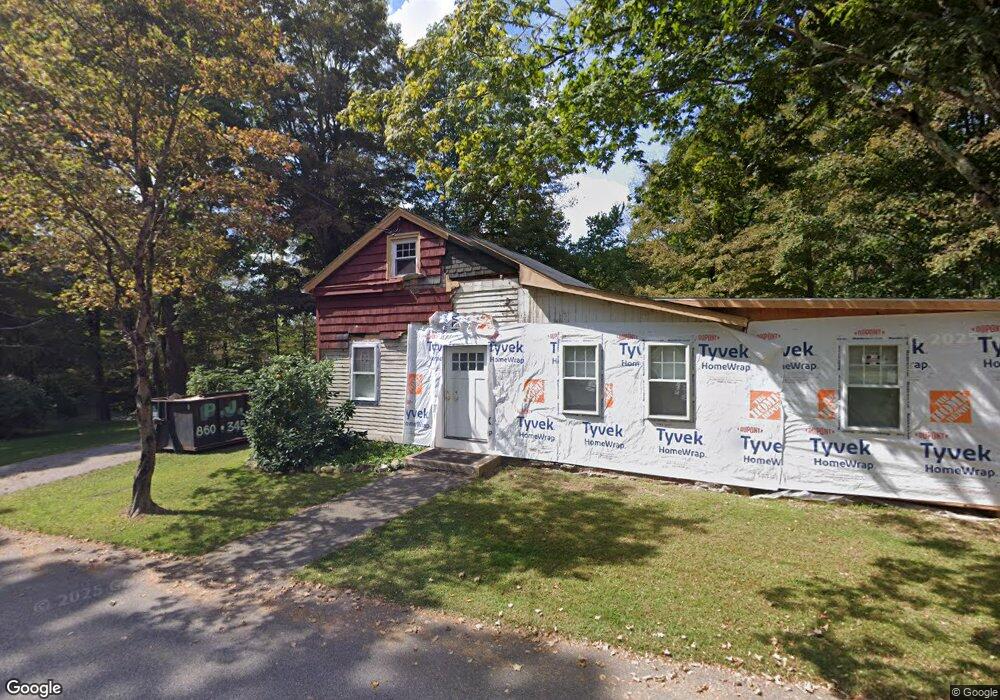
7 Oakum Dock Rd Cobalt, CT 06414
Middle Haddam NeighborhoodEstimated Value: $122,524 - $247,000
2
Beds
1
Bath
927
Sq Ft
$211/Sq Ft
Est. Value
About This Home
This home is located at 7 Oakum Dock Rd, Cobalt, CT 06414 and is currently estimated at $195,381, approximately $210 per square foot. 7 Oakum Dock Rd is a home with nearby schools including Memorial School, Center Elementary School, and East Hampton Middle School.
Ownership History
Date
Name
Owned For
Owner Type
Purchase Details
Closed on
Dec 16, 2021
Sold by
Doherty Edward C
Bought by
Spinato David and Spinato Irene
Current Estimated Value
Purchase Details
Closed on
Nov 27, 2019
Sold by
Us Bank Na
Bought by
Usa Hud
Purchase Details
Closed on
Apr 27, 2004
Sold by
Shramek David R
Bought by
Gagnon Steven R
Home Financials for this Owner
Home Financials are based on the most recent Mortgage that was taken out on this home.
Original Mortgage
$133,900
Interest Rate
5.4%
Mortgage Type
Purchase Money Mortgage
Purchase Details
Closed on
Oct 6, 2000
Sold by
Stewart George A
Bought by
Shramek David R
Home Financials for this Owner
Home Financials are based on the most recent Mortgage that was taken out on this home.
Original Mortgage
$77,600
Interest Rate
7.96%
Mortgage Type
Purchase Money Mortgage
Create a Home Valuation Report for This Property
The Home Valuation Report is an in-depth analysis detailing your home's value as well as a comparison with similar homes in the area
Home Values in the Area
Average Home Value in this Area
Purchase History
| Date | Buyer | Sale Price | Title Company |
|---|---|---|---|
| Spinato David | $80,000 | None Available | |
| Spinato David | $80,000 | None Available | |
| Usa Hud | -- | -- | |
| Usa Hud | -- | -- | |
| Gagnon Steven R | $136,000 | -- | |
| Gagnon Steven R | $136,000 | -- | |
| Shramek David R | $80,000 | -- | |
| Shramek David R | $80,000 | -- |
Source: Public Records
Mortgage History
| Date | Status | Borrower | Loan Amount |
|---|---|---|---|
| Previous Owner | Shramek David R | $133,900 | |
| Previous Owner | Shramek David R | $5,689 | |
| Previous Owner | Shramek David R | $77,600 |
Source: Public Records
Tax History
| Year | Tax Paid | Tax Assessment Tax Assessment Total Assessment is a certain percentage of the fair market value that is determined by local assessors to be the total taxable value of land and additions on the property. | Land | Improvement |
|---|---|---|---|---|
| 2025 | $3,811 | $95,960 | $31,630 | $64,330 |
| 2024 | $3,650 | $95,960 | $31,630 | $64,330 |
| 2023 | $3,512 | $97,390 | $31,630 | $65,760 |
| 2022 | $3,376 | $97,390 | $31,630 | $65,760 |
| 2021 | $3,363 | $97,390 | $31,630 | $65,760 |
| 2020 | $3,153 | $95,130 | $31,630 | $63,500 |
| 2019 | $2,974 | $89,750 | $33,290 | $56,460 |
| 2018 | $2,811 | $89,750 | $33,290 | $56,460 |
| 2017 | $2,811 | $89,750 | $33,290 | $56,460 |
| 2016 | $2,642 | $89,750 | $33,290 | $56,460 |
| 2015 | $2,832 | $101,930 | $39,170 | $62,760 |
| 2014 | $2,464 | $101,930 | $39,170 | $62,760 |
Source: Public Records
Map
Nearby Homes
- 58 Middle Haddam Rd
- 89 Gadpouch Rd
- 76 Maple Rd
- 226 W High St
- 0 Jobs Pond Rd
- Lot 2 Aldens Crossing
- 8 Aldens Crossing
- 38 Old Middletown Ave
- 95 Tarragon Dr
- 171 Bartlett St
- 1 Young St
- 1263, 1306, 1316, 13 Pecausett Meadows
- 95 Training Hill Rd
- 426 Cox Rd Unit 4
- 402 Cox Rd Unit 8
- 414 Cox Rd Unit 6
- 432 Cox Rd Unit 3
- 408 Cox Rd Unit 7
- 420 Cox Rd Unit 5
- 438 Cox Rd Unit 2
- 27 Oakum Dock Rd
- 36 Oakum Dock Rd
- 30 Oakum Dock Rd
- 28 Oakum Dock Rd
- 26 Oakum Dock Rd
- 33 Oakum Dock Rd
- 38 Oakum Dock Rd
- 42 Oakum Dock Rd
- 10 Oakum Dock Rd
- 6 Oakum Dock Rd
- 27 Oakum Dock Rd
- 28 Oakum Dock Rd
- 31 Oakum Dock Rd
- 33 Oakum Dock Rd
- 2079 Portland Cobalt Rd
- 7 Oakum Dock Rd
- 32 Oakum Dock Rd
- 40 Oakum Dock Rd
- 32 Oakum Dock Rd
- 30 Oakum Dock Rd
Your Personal Tour Guide
Ask me questions while you tour the home.