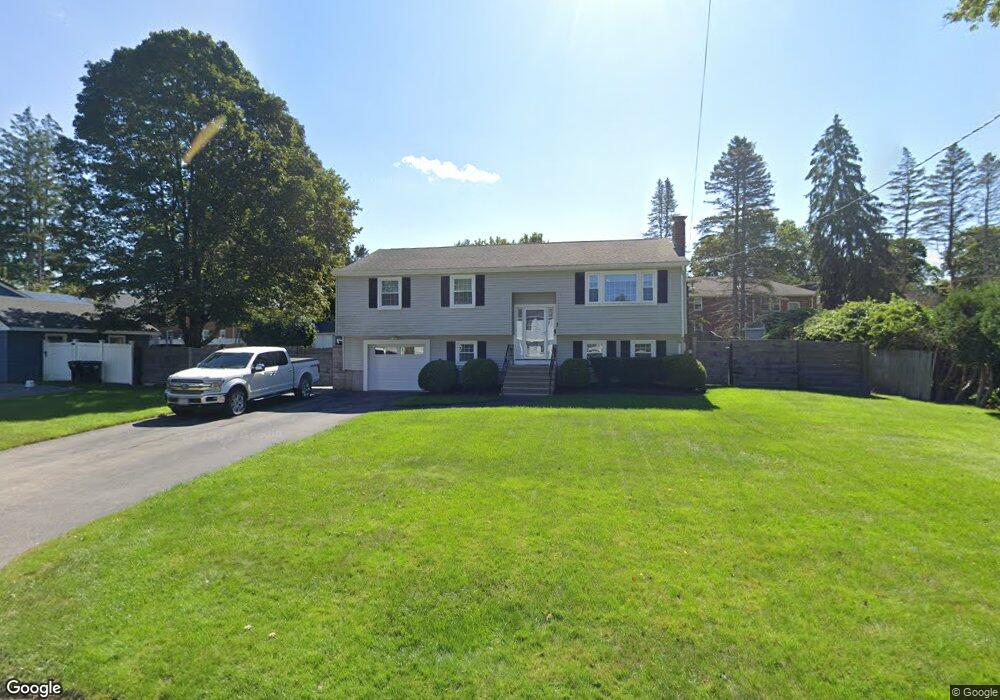
7 Oakview Ave Millis, MA 02054
Estimated Value: $542,000 - $689,000
3
Beds
2
Baths
1,046
Sq Ft
$587/Sq Ft
Est. Value
About This Home
This home is located at 7 Oakview Ave, Millis, MA 02054 and is currently estimated at $614,028, approximately $587 per square foot. 7 Oakview Ave is a home located in Norfolk County with nearby schools including Clyde F Brown, Millis Middle School, and Millis High School.
Ownership History
Date
Name
Owned For
Owner Type
Purchase Details
Closed on
Oct 9, 2018
Sold by
Hennessey Robert L
Bought by
Lawes Ret
Current Estimated Value
Purchase Details
Closed on
Mar 21, 2018
Sold by
Ohara Ann M
Bought by
Hennessey Robert L
Purchase Details
Closed on
Apr 22, 1992
Sold by
Sherman Donald E
Bought by
Ohara Ann M
Home Financials for this Owner
Home Financials are based on the most recent Mortgage that was taken out on this home.
Original Mortgage
$120,000
Interest Rate
8.78%
Mortgage Type
Purchase Money Mortgage
Create a Home Valuation Report for This Property
The Home Valuation Report is an in-depth analysis detailing your home's value as well as a comparison with similar homes in the area
Home Values in the Area
Average Home Value in this Area
Purchase History
| Date | Buyer | Sale Price | Title Company |
|---|---|---|---|
| Lawes Ret | $425,000 | -- | |
| Hennessey Robert L | $305,000 | -- | |
| Ohara Ann M | $153,000 | -- |
Source: Public Records
Mortgage History
| Date | Status | Borrower | Loan Amount |
|---|---|---|---|
| Previous Owner | Ohara Ann M | $115,000 | |
| Previous Owner | Ohara Ann M | $120,000 | |
| Previous Owner | Ohara Ann M | $120,000 | |
| Previous Owner | Ohara Ann M | $20,000 |
Source: Public Records
Tax History
| Year | Tax Paid | Tax Assessment Tax Assessment Total Assessment is a certain percentage of the fair market value that is determined by local assessors to be the total taxable value of land and additions on the property. | Land | Improvement |
|---|---|---|---|---|
| 2025 | $9,030 | $550,600 | $233,200 | $317,400 |
| 2024 | $8,230 | $501,200 | $215,300 | $285,900 |
| 2023 | $7,797 | $445,800 | $171,600 | $274,200 |
| 2022 | $7,765 | $411,300 | $184,100 | $227,200 |
| 2021 | $7,252 | $369,600 | $159,100 | $210,500 |
| 2020 | $6,970 | $346,100 | $148,700 | $197,400 |
| 2019 | $6,227 | $333,000 | $135,600 | $197,400 |
| 2018 | $6,001 | $333,000 | $135,600 | $197,400 |
| 2017 | $5,537 | $300,600 | $116,100 | $184,500 |
| 2016 | $5,242 | $300,600 | $116,100 | $184,500 |
| 2015 | $5,110 | $300,600 | $116,100 | $184,500 |
Source: Public Records
Map
Nearby Homes
- 6 Rosenfeld Rd
- 28 Key St Unit 28
- 324 Union St Unit 1
- 22 May Rd
- 6 April Way
- 10 April Way
- 11 Parnell St
- 6 Rivendell Ln
- 20 Hemlock Cir
- 25 Bayberry Cir Unit 25
- 4 Brookview Rd
- 6 Beech St
- 64 Village St
- 33 Spencer St
- 119 Middlesex St
- 14 Teresa Dr
- 50 Walnut St
- 13 Teresa Dr
- 2 Towne Lyne Rd
- 6 Glen Ellen Blvd Unit 6
Your Personal Tour Guide
Ask me questions while you tour the home.