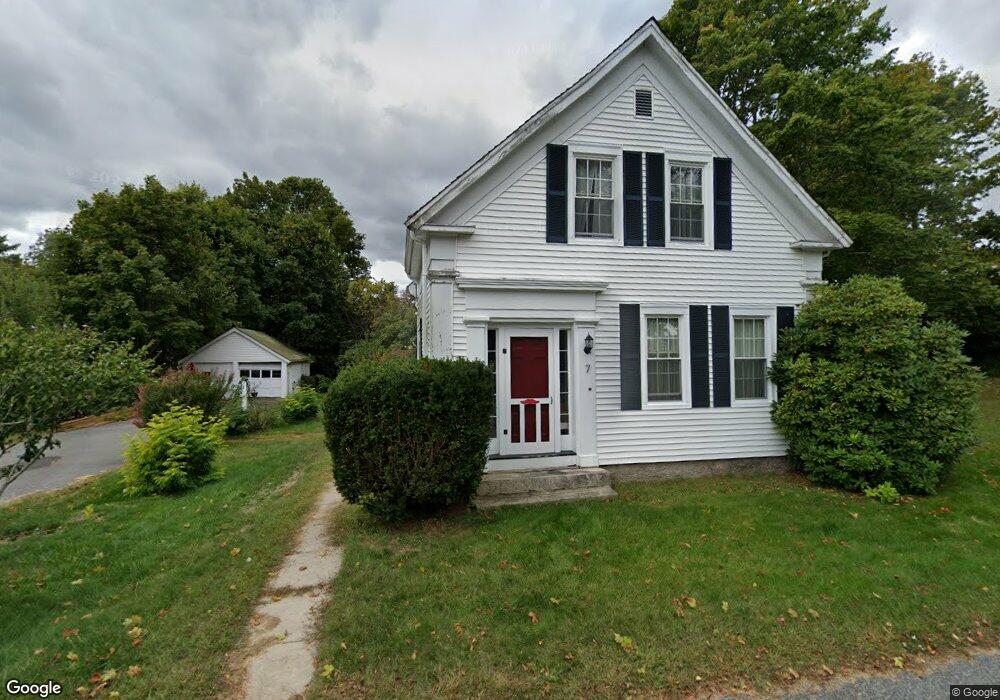
7 Old Bridge Rd Bourne, MA 2532
Buzzards Bay NeighborhoodEstimated Value: $573,000 - $736,000
4
Beds
3
Baths
2,436
Sq Ft
$268/Sq Ft
Est. Value
About This Home
This home is located at 7 Old Bridge Rd, Bourne, MA 2532 and is currently estimated at $652,881, approximately $268 per square foot. 7 Old Bridge Rd is a home located in Barnstable County with nearby schools including Bourne High School and St Margaret Regional School.
Ownership History
Date
Name
Owned For
Owner Type
Purchase Details
Closed on
Sep 16, 2011
Sold by
Graham Teresa L and Graham Allan Mary
Bought by
Dekkers Roel A
Current Estimated Value
Home Financials for this Owner
Home Financials are based on the most recent Mortgage that was taken out on this home.
Original Mortgage
$167,400
Outstanding Balance
$114,038
Interest Rate
4.38%
Mortgage Type
Purchase Money Mortgage
Estimated Equity
$538,843
Purchase Details
Closed on
Oct 2, 2009
Sold by
Lawson Jean E
Bought by
Graham Teresa L and Graham Allan Mary
Purchase Details
Closed on
Apr 28, 2000
Sold by
Hoffman Michael V and Hoffman Holli Marie
Bought by
Lawson Jean E
Purchase Details
Closed on
Jul 25, 1994
Sold by
Ford Consumer Fin Co
Bought by
Hoffman Michael and Hoffman Holli Marie
Purchase Details
Closed on
Feb 7, 1994
Sold by
Greene Martin and Greene Cheryl Ann
Bought by
Ford Consumer Fin Co
Create a Home Valuation Report for This Property
The Home Valuation Report is an in-depth analysis detailing your home's value as well as a comparison with similar homes in the area
Home Values in the Area
Average Home Value in this Area
Purchase History
| Date | Buyer | Sale Price | Title Company |
|---|---|---|---|
| Dekkers Roel A | $180,000 | -- | |
| Dekkers Roel A | $180,000 | -- | |
| Graham Teresa L | -- | -- | |
| Graham Teresa L | -- | -- | |
| Lawson Jean E | $159,900 | -- | |
| Lawson Jean E | $159,900 | -- | |
| Hoffman Michael | $118,000 | -- | |
| Hoffman Michael V | $118,000 | -- | |
| Ford Consumer Fin Co | $95,306 | -- | |
| Ford Consumer Fin Co | $95,306 | -- |
Source: Public Records
Mortgage History
| Date | Status | Borrower | Loan Amount |
|---|---|---|---|
| Open | Dekkers Roel A | $167,400 | |
| Closed | Ford Consumer Fin Co | $167,400 | |
| Previous Owner | Ford Consumer Fin Co | $75,000 |
Source: Public Records
Tax History
| Year | Tax Paid | Tax Assessment Tax Assessment Total Assessment is a certain percentage of the fair market value that is determined by local assessors to be the total taxable value of land and additions on the property. | Land | Improvement |
|---|---|---|---|---|
| 2025 | $4,575 | $585,800 | $196,200 | $389,600 |
| 2024 | $4,474 | $557,900 | $186,900 | $371,000 |
| 2023 | $4,389 | $498,200 | $165,400 | $332,800 |
| 2022 | $4,155 | $411,800 | $146,400 | $265,400 |
| 2021 | $4,046 | $375,700 | $133,200 | $242,500 |
| 2020 | $3,855 | $358,900 | $131,900 | $227,000 |
| 2019 | $3,643 | $346,600 | $131,900 | $214,700 |
| 2018 | $3,418 | $324,300 | $119,400 | $204,900 |
| 2017 | $2,882 | $279,800 | $118,300 | $161,500 |
| 2016 | $1,708 | $168,100 | $105,800 | $62,300 |
| 2015 | $1,693 | $168,100 | $105,800 | $62,300 |
Source: Public Records
Map
Nearby Homes
- 304 Main St
- 38 Old Bridge Rd
- 6 Honora Ct
- 3 Honora Ln Unit 3
- 58 Maple St
- 23 Alderberry Rd
- 46 Holt Rd Unit B
- 46 Holt Rd
- 60 Sandwich Rd
- 44 Cotuit Rd
- 10 Sandy Ln
- 40-A Lafayette Ave
- 5 Zoli Ln
- 4 Van Bummel Rd
- 24 Ships View Terrace
- 60 Bourne Neck Dr
- 13 Laurel Hill Ct
- 5 Sea Knoll Ct
- 29 Weather Deck Rd
- 810 Head of The Bay Rd
- 7 Old Bridge Rd
- 9 Old Bridge Rd
- 282 Main St Unit 2
- 282 Main St
- 6 Old Bridge Rd
- 278 Main St
- 11 Old Bridge Rd
- 11 Old Bridge Rd
- 11 Old Bridge Rd
- 13 Old Bridge Rd
- 13 Old Bridge Rd
- 15 Old Bridge Rd
- 279 Main St Unit 279
- 279 Main St Unit 1
- 279 Main St Unit *
- 279 Main St
- 279 Main St
- 0 Old Bridge Rd
- 277 Main St
- 277 Main St
Your Personal Tour Guide
Ask me questions while you tour the home.