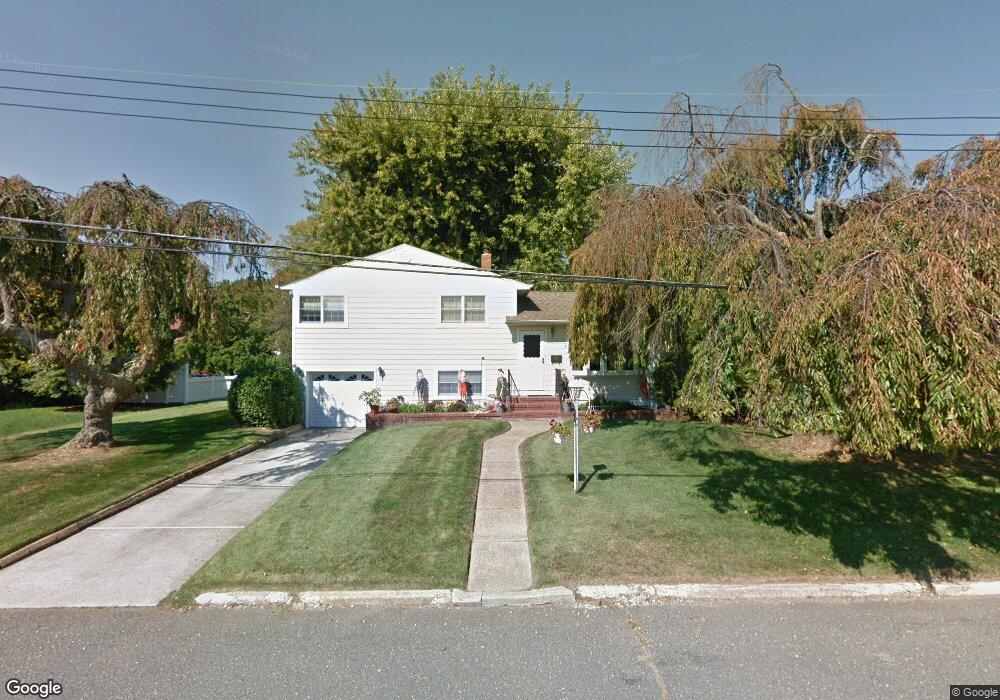
7 Orchard Rd West Long Branch, NJ 07764
Estimated Value: $747,000 - $1,003,000
3
Beds
2
Baths
1,464
Sq Ft
$599/Sq Ft
Est. Value
About This Home
This home is located at 7 Orchard Rd, West Long Branch, NJ 07764 and is currently estimated at $876,569, approximately $598 per square foot. 7 Orchard Rd is a home located in Monmouth County with nearby schools including Betty McElmon Elementary School, Frank Antonides School, and Shore Regional High School.
Ownership History
Date
Name
Owned For
Owner Type
Purchase Details
Closed on
Dec 23, 2021
Sold by
Dwek Joseph and Dabah Kim
Bought by
Sharaby Rachel and Sharaby Solomon V
Current Estimated Value
Home Financials for this Owner
Home Financials are based on the most recent Mortgage that was taken out on this home.
Original Mortgage
$347,200
Outstanding Balance
$319,333
Interest Rate
3.11%
Mortgage Type
New Conventional
Estimated Equity
$557,236
Purchase Details
Closed on
Jul 12, 2017
Sold by
Gasperini Patricia Ann and Gasperini Robert B
Bought by
Ronald Adjmi 2012 Irrevocable Trust
Create a Home Valuation Report for This Property
The Home Valuation Report is an in-depth analysis detailing your home's value as well as a comparison with similar homes in the area
Home Values in the Area
Average Home Value in this Area
Purchase History
| Date | Buyer | Sale Price | Title Company |
|---|---|---|---|
| Sharaby Rachel | $434,100 | Madison Title Agency Llc | |
| Ronald Adjmi 2012 Irrevocable Trust | $340,000 | None Available |
Source: Public Records
Mortgage History
| Date | Status | Borrower | Loan Amount |
|---|---|---|---|
| Open | Sharaby Rachel | $347,200 |
Source: Public Records
Tax History Compared to Growth
Tax History
| Year | Tax Paid | Tax Assessment Tax Assessment Total Assessment is a certain percentage of the fair market value that is determined by local assessors to be the total taxable value of land and additions on the property. | Land | Improvement |
|---|---|---|---|---|
| 2025 | $11,112 | $1,304,500 | $560,300 | $744,200 |
| 2024 | $10,658 | $852,800 | $483,300 | $369,500 |
| 2023 | $10,658 | $762,900 | $402,000 | $360,900 |
| 2022 | $8,509 | $652,300 | $302,000 | $350,300 |
| 2021 | $8,509 | $440,200 | $226,000 | $214,200 |
| 2020 | $7,651 | $372,300 | $201,000 | $171,300 |
| 2019 | $7,589 | $371,300 | $201,000 | $170,300 |
| 2018 | $7,252 | $342,700 | $191,600 | $151,100 |
| 2017 | $7,492 | $338,100 | $191,600 | $146,500 |
| 2016 | $7,493 | $345,000 | $204,200 | $140,800 |
| 2015 | $7,423 | $337,200 | $204,200 | $133,000 |
| 2014 | $6,851 | $293,900 | $167,000 | $126,900 |
Source: Public Records
Map
Nearby Homes
- 2 Hilltop Rd
- 54 Wall St
- 88 Norwood Ave
- 11 Fairway Ave
- 21 Dennis St
- 11 Golf St
- 264 Norwood Ave
- 28 Norwood Ave
- 153 Vanderbilt Ave
- 440 W End Ave
- 7 Linden Ave
- 317 Norwood Ave
- 570 Monmouth Place
- 57 Hollywood Ave
- 11 Clay St
- 552 Westwood Ave
- 388 Brookdale Ave
- 434 Westwood Ave
- 448 Monmouth Place
- 399 Willow Ave
- 11 Orchard Rd
- 160 Oakwood Ave
- 100 Oakwood Ave
- 15 Orchard Rd
- 5 Melissa Ct
- 166 Oakwood Ave
- 10 Orchard Rd
- 96 Oakwood Ave
- 14 Orchard Rd
- 19 Orchard Rd
- 692 Gerard Ave
- 174 Oakwood Ave
- 8 Melissa Ct
- 123 Oakwood Ave
- 92 Oakwood Ave
- 143 Oakwood Ave
- 7 W Campbell Ave
- 18 Orchard Rd
- 147 Oakwood Ave
- 147 Oakwood Ave Unit ANNUAL