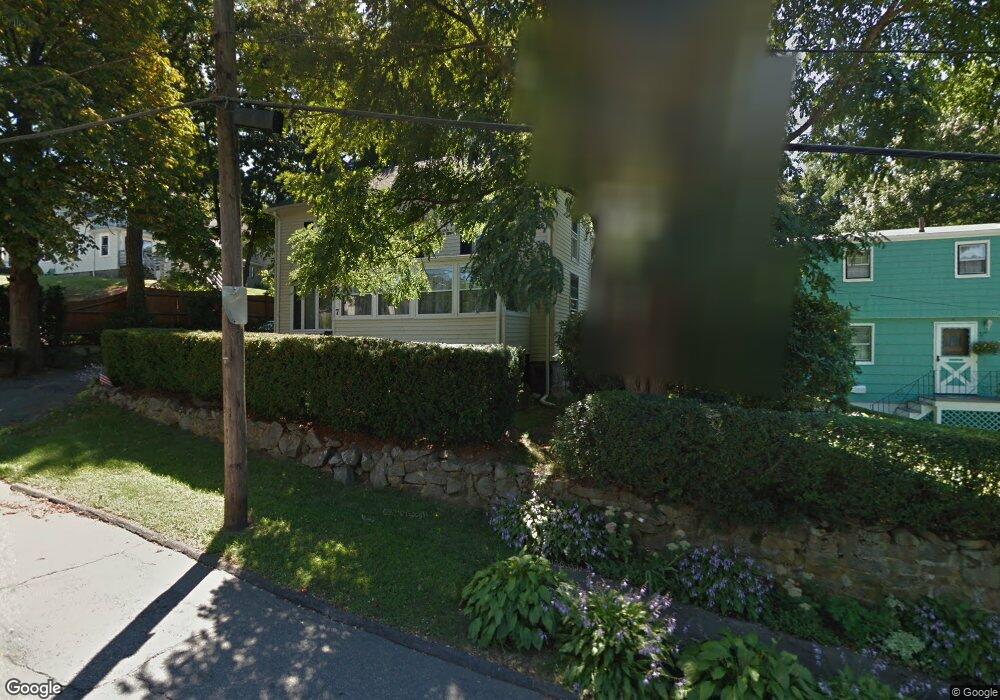
7 Overlea Ave Peabody, MA 01960
South Peabody NeighborhoodEstimated Value: $632,974 - $733,000
5
Beds
2
Baths
1,644
Sq Ft
$421/Sq Ft
Est. Value
About This Home
This home is located at 7 Overlea Ave, Peabody, MA 01960 and is currently estimated at $692,494, approximately $421 per square foot. 7 Overlea Ave is a home located in Essex County with nearby schools including Peabody Veterans Memorial High School, North Shore Christian School, and St. Pius V. School.
Ownership History
Date
Name
Owned For
Owner Type
Purchase Details
Closed on
Sep 14, 2001
Sold by
Lanza Robert T
Bought by
Depatto Charise A and Depatto Audrey
Current Estimated Value
Purchase Details
Closed on
Feb 15, 1995
Sold by
Tourtillott John
Bought by
Lanza Robert T and Lanza Jennifer
Home Financials for this Owner
Home Financials are based on the most recent Mortgage that was taken out on this home.
Original Mortgage
$121,600
Interest Rate
9.19%
Mortgage Type
Purchase Money Mortgage
Create a Home Valuation Report for This Property
The Home Valuation Report is an in-depth analysis detailing your home's value as well as a comparison with similar homes in the area
Home Values in the Area
Average Home Value in this Area
Purchase History
| Date | Buyer | Sale Price | Title Company |
|---|---|---|---|
| Depatto Charise A | $259,000 | -- | |
| Lanza Robert T | $128,000 | -- |
Source: Public Records
Mortgage History
| Date | Status | Borrower | Loan Amount |
|---|---|---|---|
| Open | Lanza Robert T | $249,000 | |
| Closed | Lanza Robert T | $252,023 | |
| Previous Owner | Lanza Robert T | $121,600 | |
| Previous Owner | Lanza Robert T | $92,000 |
Source: Public Records
Tax History
| Year | Tax Paid | Tax Assessment Tax Assessment Total Assessment is a certain percentage of the fair market value that is determined by local assessors to be the total taxable value of land and additions on the property. | Land | Improvement |
|---|---|---|---|---|
| 2025 | $5,420 | $585,300 | $220,000 | $365,300 |
| 2024 | $5,096 | $558,800 | $220,000 | $338,800 |
| 2023 | $4,825 | $506,800 | $196,500 | $310,300 |
| 2022 | $4,454 | $441,000 | $175,500 | $265,500 |
| 2021 | $4,026 | $383,800 | $159,500 | $224,300 |
| 2020 | $4,190 | $390,100 | $159,500 | $230,600 |
| 2019 | $4,035 | $366,500 | $159,500 | $207,000 |
| 2018 | $3,518 | $307,000 | $145,000 | $162,000 |
| 2017 | $3,553 | $302,100 | $145,000 | $157,100 |
| 2016 | $3,427 | $287,500 | $145,000 | $142,500 |
| 2015 | $2,964 | $241,000 | $141,400 | $99,600 |
Source: Public Records
Map
Nearby Homes
- 10 Fairview Rd
- 18 Kittredge St
- 16 Sunset Dr
- 73 Lockwood Rd
- 26 Bartholomew Terrace
- 175 Jenness St
- 30 Longwood Rd
- 38 Ledgemont Ln
- 52 Savory St
- 11 Urban St
- 103 Kernwood Dr
- 333 Lynnfield St
- 31 Atkins Ave
- 5 Floyd Ave
- 354 Broadway Unit 3
- 100 Magnolia Ave Unit 5
- 12 Tara Rd
- 22 Strongwater Dr
- 6 Allen Rd
- 18 Strongwater Dr
Your Personal Tour Guide
Ask me questions while you tour the home.