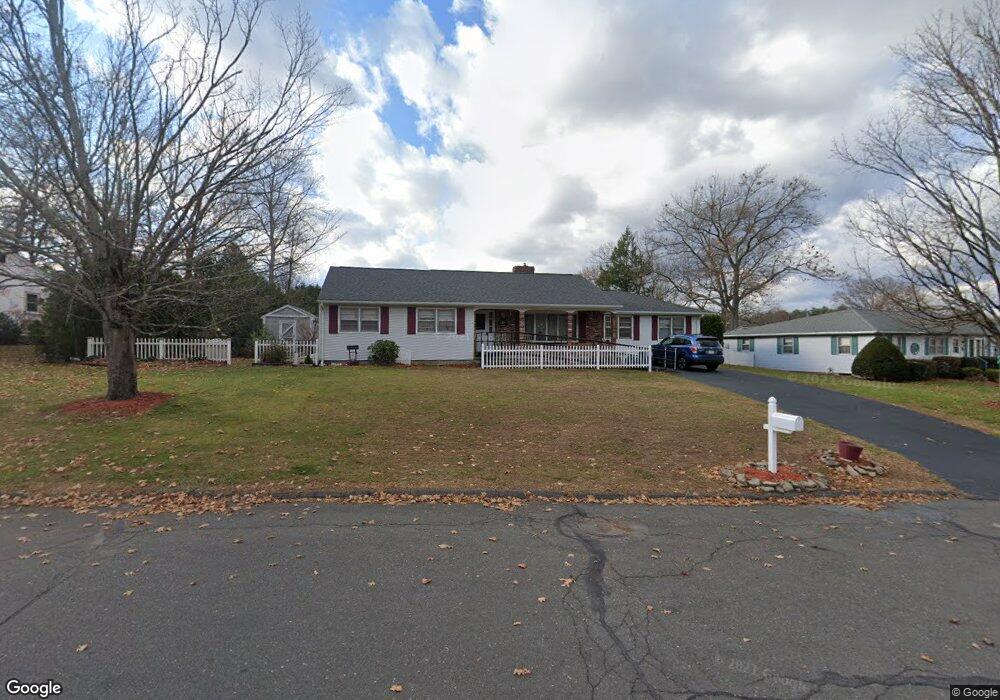
7 Overlook Dr Easthampton, MA 01027
Estimated Value: $468,010 - $529,000
3
Beds
3
Baths
1,786
Sq Ft
$277/Sq Ft
Est. Value
About This Home
This home is located at 7 Overlook Dr, Easthampton, MA 01027 and is currently estimated at $494,003, approximately $276 per square foot. 7 Overlook Dr is a home located in Hampshire County with nearby schools including Easthampton High School, Tri-County Schools, and New England Adolescent Research Institute.
Ownership History
Date
Name
Owned For
Owner Type
Purchase Details
Closed on
Apr 4, 2023
Sold by
Dunham 2007 Ret
Bought by
7 Overlook Drive T
Current Estimated Value
Purchase Details
Closed on
Sep 19, 2007
Sold by
Dunham James P and Dunham Kathleen M
Bought by
Dunham Ret and Dunham James P
Create a Home Valuation Report for This Property
The Home Valuation Report is an in-depth analysis detailing your home's value as well as a comparison with similar homes in the area
Home Values in the Area
Average Home Value in this Area
Purchase History
We collect this data history from publicly available records. To have your information removed, we recommend requesting removal directly through your county’s website.
| Date | Buyer | Sale Price | Title Company |
|---|---|---|---|
| 7 Overlook Drive T | -- | None Available | |
| Dunham Ret | -- | -- |
Source: Public Records
Tax History
| Year | Tax Paid | Tax Assessment Tax Assessment Total Assessment is a certain percentage of the fair market value that is determined by local assessors to be the total taxable value of land and additions on the property. | Land | Improvement |
|---|---|---|---|---|
| 2025 | $5,748 | $420,500 | $120,700 | $299,800 |
| 2024 | $5,557 | $409,800 | $117,300 | $292,500 |
| 2023 | $4,253 | $290,300 | $92,400 | $197,900 |
| 2022 | $4,799 | $290,300 | $92,400 | $197,900 |
| 2021 | $5,251 | $299,400 | $92,400 | $207,000 |
| 2020 | $5,156 | $290,300 | $92,400 | $197,900 |
| 2019 | $4,320 | $279,400 | $92,400 | $187,000 |
| 2018 | $4,155 | $259,700 | $87,200 | $172,500 |
| 2017 | $4,067 | $250,900 | $83,900 | $167,000 |
| 2016 | $4,228 | $271,200 | $83,900 | $187,300 |
| 2015 | $4,109 | $271,200 | $83,900 | $187,300 |
Source: Public Records
Map
Nearby Homes
Your Personal Tour Guide
Ask me questions while you tour the home.