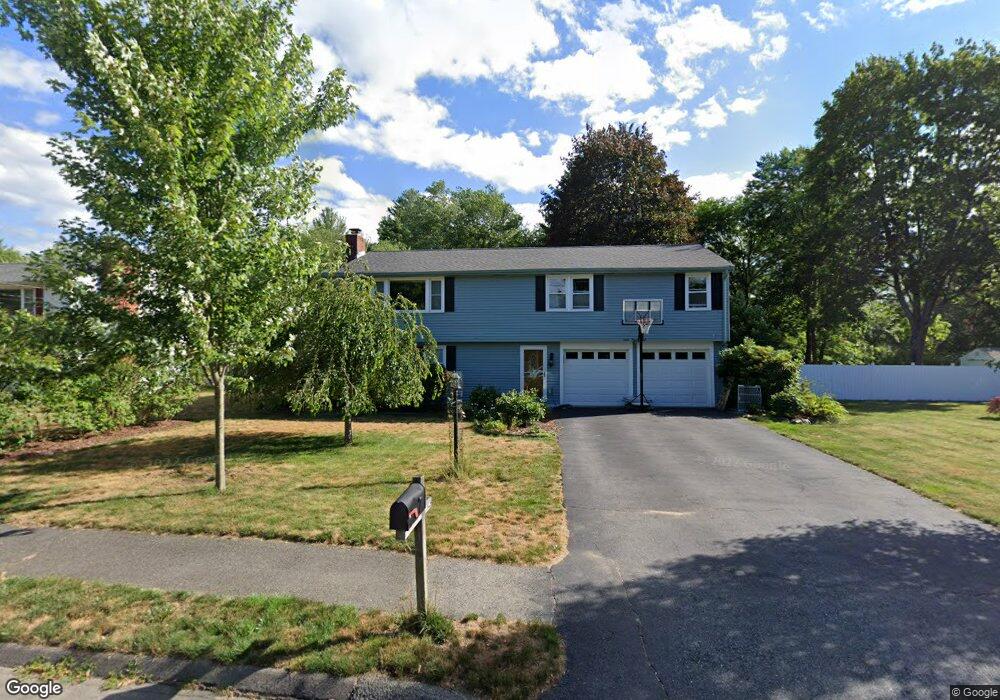
7 Pamela Rd Natick, MA 01760
Estimated Value: $884,810 - $1,149,000
4
Beds
3
Baths
1,948
Sq Ft
$515/Sq Ft
Est. Value
About This Home
This home is located at 7 Pamela Rd, Natick, MA 01760 and is currently estimated at $1,002,703, approximately $514 per square foot. 7 Pamela Rd is a home located in Middlesex County with nearby schools including Natick High School, Bennett-Hemenway (Ben-Hem) Elementary School, and Wilson Middle School.
Ownership History
Date
Name
Owned For
Owner Type
Purchase Details
Closed on
Nov 22, 2011
Sold by
Sur Gargi and Mullick Sachin
Bought by
Zhang Yi and Zhang Tianxiang
Current Estimated Value
Home Financials for this Owner
Home Financials are based on the most recent Mortgage that was taken out on this home.
Original Mortgage
$205,000
Outstanding Balance
$139,113
Interest Rate
3.92%
Mortgage Type
Purchase Money Mortgage
Estimated Equity
$863,590
Purchase Details
Closed on
May 31, 2005
Sold by
Breen Lillian B and Breen Morton Robert
Bought by
Gargi
Home Financials for this Owner
Home Financials are based on the most recent Mortgage that was taken out on this home.
Original Mortgage
$354,900
Interest Rate
5.94%
Mortgage Type
Purchase Money Mortgage
Create a Home Valuation Report for This Property
The Home Valuation Report is an in-depth analysis detailing your home's value as well as a comparison with similar homes in the area
Home Values in the Area
Average Home Value in this Area
Purchase History
| Date | Buyer | Sale Price | Title Company |
|---|---|---|---|
| Zhang Yi | $486,000 | -- | |
| Gargi | $499,900 | -- |
Source: Public Records
Mortgage History
| Date | Status | Borrower | Loan Amount |
|---|---|---|---|
| Open | Zhang Yi | $205,000 | |
| Previous Owner | Gargi | $354,900 |
Source: Public Records
Tax History
| Year | Tax Paid | Tax Assessment Tax Assessment Total Assessment is a certain percentage of the fair market value that is determined by local assessors to be the total taxable value of land and additions on the property. | Land | Improvement |
|---|---|---|---|---|
| 2025 | $9,075 | $758,800 | $473,400 | $285,400 |
| 2024 | $8,750 | $713,700 | $447,200 | $266,500 |
| 2023 | $8,484 | $671,200 | $418,700 | $252,500 |
| 2022 | $8,195 | $614,300 | $380,200 | $234,100 |
| 2021 | $7,880 | $579,000 | $359,400 | $219,600 |
| 2020 | $7,667 | $563,300 | $343,700 | $219,600 |
| 2019 | $7,160 | $563,300 | $343,700 | $219,600 |
| 2018 | $9,255 | $550,500 | $312,500 | $238,000 |
| 2017 | $6,937 | $514,200 | $280,600 | $233,600 |
| 2016 | $6,746 | $497,100 | $265,600 | $231,500 |
| 2015 | $6,602 | $477,700 | $265,600 | $212,100 |
Source: Public Records
Map
Nearby Homes
Your Personal Tour Guide
Ask me questions while you tour the home.