Estimated Value: $1,390,000 - $1,917,000
4
Beds
4
Baths
2,600
Sq Ft
$596/Sq Ft
Est. Value
About This Home
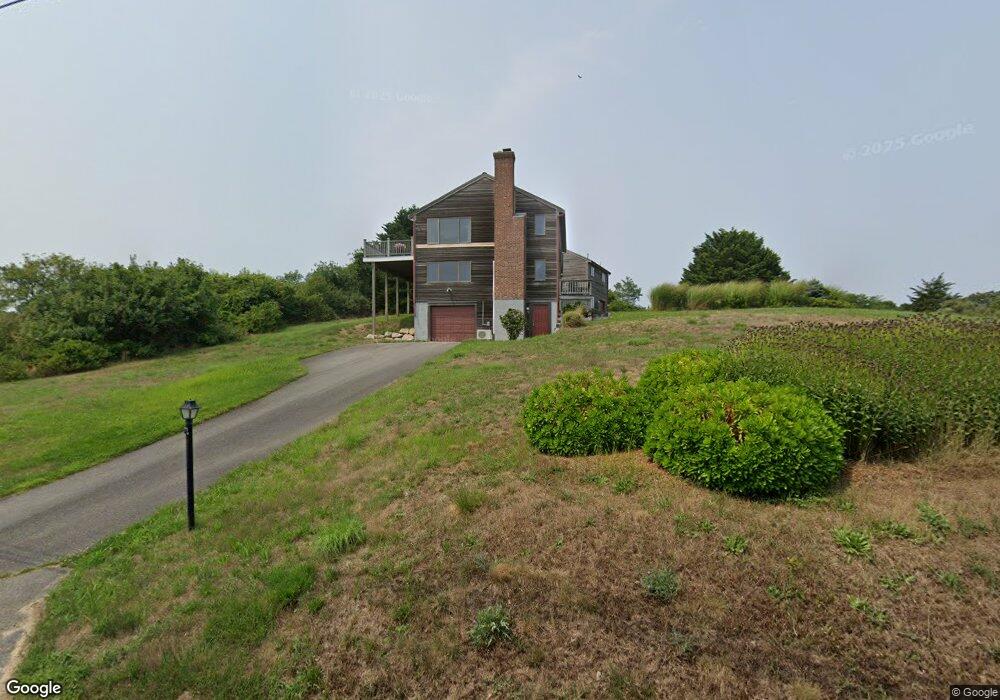
This home is located at 7 Perry Rd, Truro, MA 2666 and is currently estimated at $1,549,632, approximately $596 per square foot. 7 Perry Rd is a home located in Barnstable County with nearby schools including Truro Central School.
Ownership History
Date
Name
Owned For
Owner Type
Purchase Details
Closed on
May 27, 2025
Sold by
Mexican Shmarock Llc
Bought by
Gonazlez Oneill Lt and Gonzalez
Current Estimated Value
Purchase Details
Closed on
Oct 27, 2010
Sold by
Gonzalez Humberto and Oneill Peter
Bought by
Mexican Shamrock Llc
Home Financials for this Owner
Home Financials are based on the most recent Mortgage that was taken out on this home.
Original Mortgage
$105,000
Interest Rate
4.39%
Purchase Details
Closed on
Jan 6, 2010
Sold by
Gonzalez Humberto and Oneill Peter
Bought by
Mexican Shamrock Llc
Purchase Details
Closed on
Mar 27, 2008
Sold by
Perry Scott W
Bought by
Gonzalez Humberto and Oneill Peter
Create a Home Valuation Report for This Property
The Home Valuation Report is an in-depth analysis detailing your home's value as well as a comparison with similar homes in the area
Home Values in the Area
Average Home Value in this Area
Purchase History
| Date | Buyer | Sale Price | Title Company |
|---|---|---|---|
| Gonazlez Oneill Lt | -- | -- | |
| Gonazlez Oneill Lt | -- | -- | |
| Gonazlez Oneill Lt | -- | -- | |
| Mexican Shamrock Llc | -- | -- | |
| Gonzalez Humberto | -- | -- | |
| Gonzalez Humberto | -- | -- | |
| Mexican Shamrock Llc | -- | -- | |
| Gonzalez Humberto | -- | -- | |
| Mexican Shamrock Llc | -- | -- | |
| Mexican Shamrock Llc | -- | -- | |
| Gonzalez Humberto | $750,000 | -- | |
| Gonzalez Humberto | $750,000 | -- |
Source: Public Records
Mortgage History
| Date | Status | Borrower | Loan Amount |
|---|---|---|---|
| Previous Owner | Mexican Shamrock Llc | $105,000 |
Source: Public Records
Tax History
| Year | Tax Paid | Tax Assessment Tax Assessment Total Assessment is a certain percentage of the fair market value that is determined by local assessors to be the total taxable value of land and additions on the property. | Land | Improvement |
|---|---|---|---|---|
| 2025 | $8,600 | $1,391,600 | $648,600 | $743,000 |
| 2024 | $7,970 | $1,330,500 | $642,200 | $688,300 |
| 2023 | $6,913 | $1,057,100 | $485,600 | $571,500 |
| 2022 | $6,569 | $849,800 | $418,600 | $431,200 |
| 2021 | $5,913 | $801,200 | $418,600 | $382,600 |
| 2020 | $6,270 | $855,400 | $476,500 | $378,900 |
| 2019 | $6,257 | $839,900 | $476,500 | $363,400 |
| 2018 | $5,985 | $812,100 | $476,500 | $335,600 |
| 2017 | $5,571 | $798,200 | $476,500 | $321,700 |
| 2016 | $4,939 | $729,500 | $410,300 | $319,200 |
| 2015 | $4,760 | $717,900 | $406,300 | $311,600 |
Source: Public Records
Map
Nearby Homes
- 4 Resolution Rd
- 2 Resolution Rd
- 25 Resolution Rd
- 2 Aldrich Rd
- 7 Great Hollow Rd Unit 50
- 52 Corn Hill Rd
- 7 Great Hollow Rd Unit 50
- 3 Bayberry Rd
- 27 Fishermans Rd
- 2 Meetinghouse Rd Unit 2
- 7 Fishermans Rd
- 23 Crestview Cir
- 4 S Highland Rd Unit C
- 63 Old Kings Hwy
- 34 Truro Center Rd
- 3 N Union Field Rd
- 32 Depot Rd
- 57 Old Kings Hwy
- 19 Old Bridge Rd
- 9 Priest Rd
Your Personal Tour Guide
Ask me questions while you tour the home.