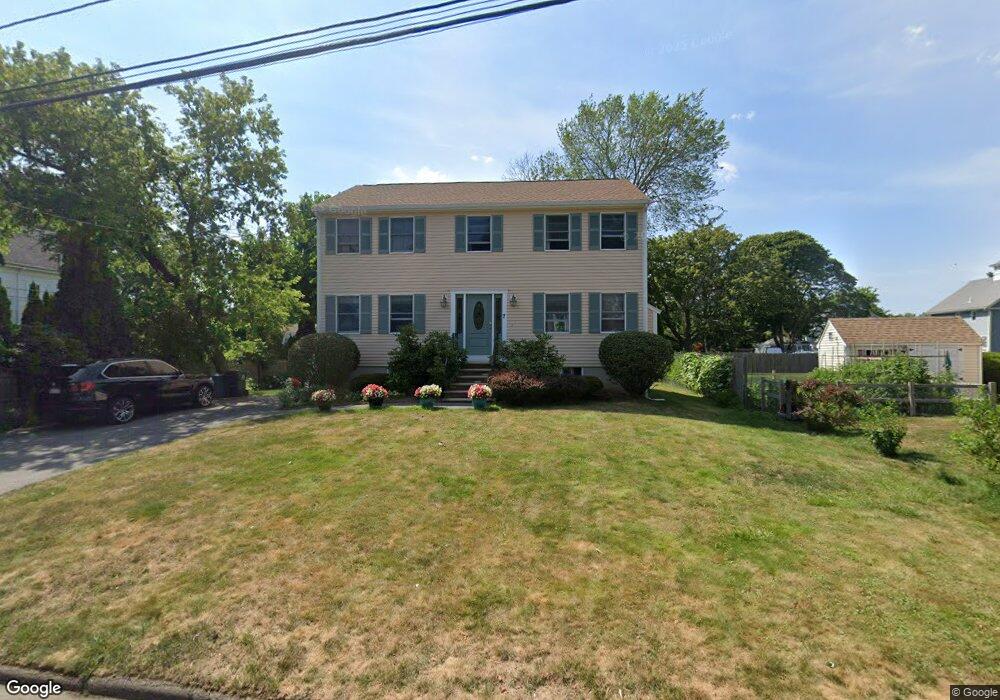
7 Perry St Danvers, MA 01923
Estimated Value: $746,000 - $765,000
4
Beds
3
Baths
1,872
Sq Ft
$406/Sq Ft
Est. Value
About This Home
This home is located at 7 Perry St, Danvers, MA 01923 and is currently estimated at $759,403, approximately $405 per square foot. 7 Perry St is a home located in Essex County with nearby schools including Danvers High School, St. Mary of the Annunciation School, and Bishop Fenwick High School.
Ownership History
Date
Name
Owned For
Owner Type
Purchase Details
Closed on
Apr 21, 2006
Sold by
Foss Donald R and Foss Phyllis E
Bought by
Cuko Piro and Cuko Shpetime
Current Estimated Value
Purchase Details
Closed on
Sep 29, 1994
Sold by
Mcniff Michael
Bought by
Foss Donald R and Foss Phyllis
Purchase Details
Closed on
May 25, 1994
Sold by
Corbett Miriam K
Bought by
Mcniff Michael P
Create a Home Valuation Report for This Property
The Home Valuation Report is an in-depth analysis detailing your home's value as well as a comparison with similar homes in the area
Home Values in the Area
Average Home Value in this Area
Purchase History
| Date | Buyer | Sale Price | Title Company |
|---|---|---|---|
| Cuko Piro | $430,000 | -- | |
| Foss Donald R | $226,925 | -- | |
| Mcniff Michael P | $60,000 | -- |
Source: Public Records
Mortgage History
| Date | Status | Borrower | Loan Amount |
|---|---|---|---|
| Open | Mcniff Michael P | $241,000 | |
| Closed | Mcniff Michael P | $245,000 |
Source: Public Records
Tax History
| Year | Tax Paid | Tax Assessment Tax Assessment Total Assessment is a certain percentage of the fair market value that is determined by local assessors to be the total taxable value of land and additions on the property. | Land | Improvement |
|---|---|---|---|---|
| 2025 | $7,093 | $645,400 | $328,900 | $316,500 |
| 2024 | $6,857 | $617,200 | $305,800 | $311,400 |
| 2023 | $6,759 | $575,200 | $285,000 | $290,200 |
| 2022 | $6,690 | $528,400 | $259,600 | $268,800 |
| 2021 | $6,551 | $490,700 | $255,700 | $235,000 |
| 2020 | $5,963 | $456,600 | $221,600 | $235,000 |
| 2019 | $5,783 | $435,500 | $207,700 | $227,800 |
| 2018 | $5,893 | $435,200 | $222,700 | $212,500 |
| 2017 | $5,264 | $371,000 | $173,100 | $197,900 |
| 2016 | $5,075 | $357,400 | $165,000 | $192,400 |
| 2015 | $4,943 | $331,500 | $150,000 | $181,500 |
Source: Public Records
Map
Nearby Homes
- 147 High St
- 6 Grant St
- 108 Abington Rd Unit 108
- 76 Water St
- 6 Mcdewell Ave Unit 4
- 61 High St
- 59 Riverview Ave
- 35 High St Unit 3D
- 14 Chase St
- 44 Foster St
- 5 Holten St
- 152 Endicott St
- 20 Central Ave
- 63 Adams St
- 10 Cottage Ave
- 97 Sylvan St Unit 7
- 14 Williams St Unit C17
- 14 Grove St
- 43 Hobart St Unit B
- 22 Braman St
Your Personal Tour Guide
Ask me questions while you tour the home.