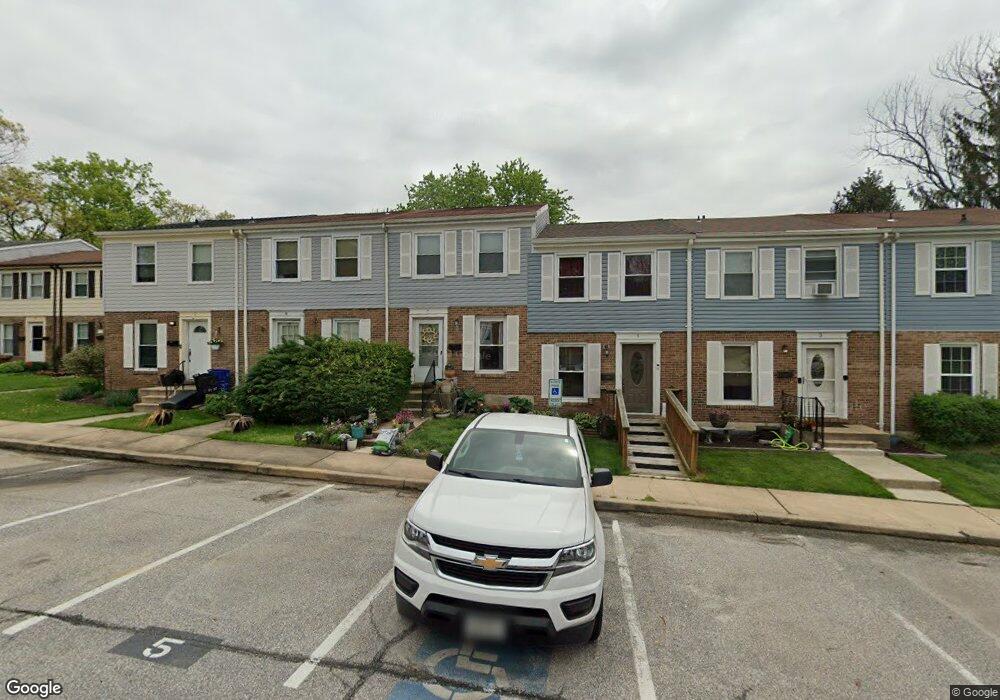
7 Pickens Ct Nottingham, MD 21236
Estimated Value: $215,222 - $248,000
3
Beds
1
Bath
1,056
Sq Ft
$224/Sq Ft
Est. Value
About This Home
This home is located at 7 Pickens Ct, Nottingham, MD 21236 and is currently estimated at $236,556, approximately $224 per square foot. 7 Pickens Ct is a home located in Baltimore County with nearby schools including Carney Elementary School, Perry Hall Middle School, and Perry Hall High School.
Ownership History
Date
Name
Owned For
Owner Type
Purchase Details
Closed on
Apr 11, 2011
Sold by
Freas Stephen P
Bought by
Bogy Charles Richard
Current Estimated Value
Home Financials for this Owner
Home Financials are based on the most recent Mortgage that was taken out on this home.
Original Mortgage
$155,846
Outstanding Balance
$107,971
Interest Rate
4.89%
Mortgage Type
FHA
Estimated Equity
$128,585
Purchase Details
Closed on
Apr 1, 2011
Sold by
Freas Stephen P
Bought by
Bogy Charles Richard
Home Financials for this Owner
Home Financials are based on the most recent Mortgage that was taken out on this home.
Original Mortgage
$155,846
Outstanding Balance
$107,971
Interest Rate
4.89%
Mortgage Type
FHA
Estimated Equity
$128,585
Purchase Details
Closed on
Jun 16, 1997
Sold by
Beard Russell O
Bought by
Freas Stephen P and Freas Shawna L
Purchase Details
Closed on
May 23, 1987
Sold by
Gahm Faith Susan
Bought by
Beard Russell O 4Th
Create a Home Valuation Report for This Property
The Home Valuation Report is an in-depth analysis detailing your home's value as well as a comparison with similar homes in the area
Home Values in the Area
Average Home Value in this Area
Purchase History
| Date | Buyer | Sale Price | Title Company |
|---|---|---|---|
| Bogy Charles Richard | $159,900 | -- | |
| Bogy Charles Richard | $159,900 | -- | |
| Freas Stephen P | $82,000 | -- | |
| Beard Russell O 4Th | $59,900 | -- |
Source: Public Records
Mortgage History
| Date | Status | Borrower | Loan Amount |
|---|---|---|---|
| Open | Bogy Charles Richard | $155,846 | |
| Closed | Bogy Charles Richard | $155,846 |
Source: Public Records
Tax History
| Year | Tax Paid | Tax Assessment Tax Assessment Total Assessment is a certain percentage of the fair market value that is determined by local assessors to be the total taxable value of land and additions on the property. | Land | Improvement |
|---|---|---|---|---|
| 2025 | $2,927 | $163,533 | -- | -- |
| 2024 | $2,927 | $153,267 | $0 | $0 |
| 2023 | $1,382 | $143,000 | $48,000 | $95,000 |
| 2022 | $2,681 | $141,200 | $0 | $0 |
| 2021 | $2,620 | $139,400 | $0 | $0 |
| 2020 | $2,620 | $137,600 | $48,000 | $89,600 |
| 2019 | $2,571 | $135,100 | $0 | $0 |
| 2018 | $2,503 | $132,600 | $0 | $0 |
| 2017 | $2,350 | $130,100 | $0 | $0 |
| 2016 | $2,513 | $130,100 | $0 | $0 |
| 2015 | $2,513 | $130,100 | $0 | $0 |
| 2014 | $2,513 | $136,400 | $0 | $0 |
Source: Public Records
Map
Nearby Homes
- 23 Coatsbridge Ct
- 26 Coatsbridge Ct
- 9 Slavin Ct
- 3 Slavin Ct
- 4202 Louisa Ave
- 8330 Belair Rd
- 1 Broadleaf Ct
- 24 Lerner Ct
- 3719 Green Oak Ct
- 3711 Green Oak Ct
- 21 Kintore Ct
- 4222 Klosterman Ave
- 4231 Plumer Ave
- 8 Hardwood Dr
- 34 Hardwood Dr
- 58 Hardwood Dr
- 9102 Lamaze Rd
- 27 Cavan Green
- 3407 Orbitan Rd
- 3754 Foxford Stream Rd
Your Personal Tour Guide
Ask me questions while you tour the home.