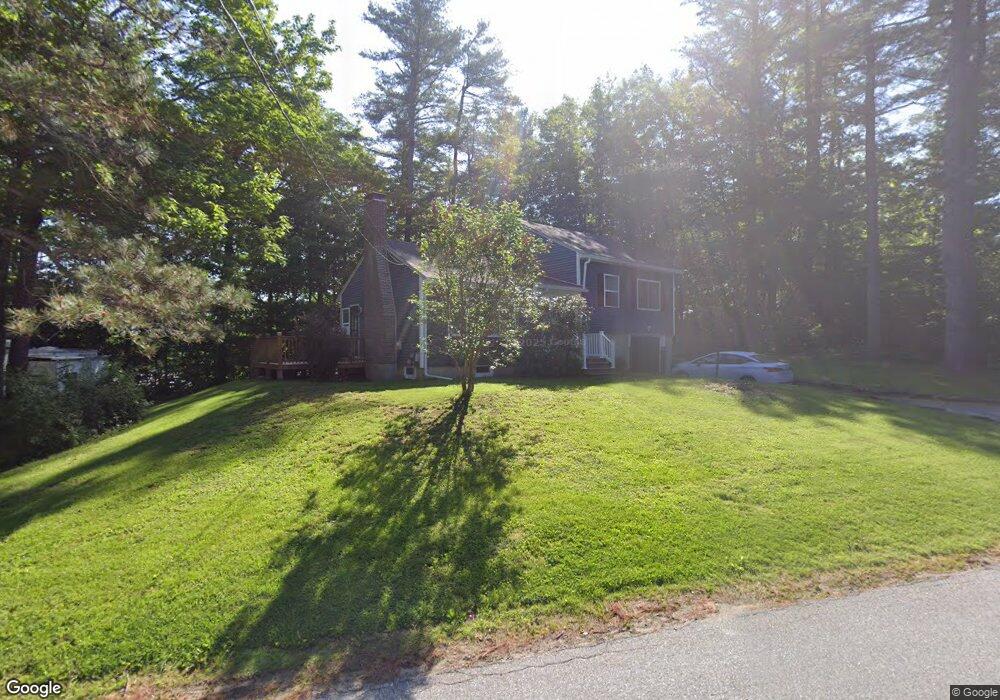
7 Pine St Farmingdale, ME 04344
Estimated Value: $348,000 - $470,000
3
Beds
3
Baths
2,500
Sq Ft
$160/Sq Ft
Est. Value
About This Home
This home is located at 7 Pine St, Farmingdale, ME 04344 and is currently estimated at $399,043, approximately $159 per square foot. 7 Pine St is a home located in Kennebec County with nearby schools including Hall-Dale Elementary School, Dresden Elementary School, and Marcia Buker School.
Ownership History
Date
Name
Owned For
Owner Type
Purchase Details
Closed on
Feb 1, 2018
Sold by
Albert Loree R and Howe Bryan D
Bought by
Howe Loree R
Current Estimated Value
Home Financials for this Owner
Home Financials are based on the most recent Mortgage that was taken out on this home.
Original Mortgage
$137,831
Outstanding Balance
$97,578
Interest Rate
3.87%
Mortgage Type
FHA
Estimated Equity
$301,465
Purchase Details
Closed on
Nov 14, 2005
Sold by
Whytock Jane W and Whytock Robert D
Bought by
Albert Loree R
Home Financials for this Owner
Home Financials are based on the most recent Mortgage that was taken out on this home.
Original Mortgage
$113,200
Interest Rate
7%
Mortgage Type
Commercial
Create a Home Valuation Report for This Property
The Home Valuation Report is an in-depth analysis detailing your home's value as well as a comparison with similar homes in the area
Home Values in the Area
Average Home Value in this Area
Purchase History
| Date | Buyer | Sale Price | Title Company |
|---|---|---|---|
| Howe Loree R | -- | -- | |
| Albert Loree R | -- | -- |
Source: Public Records
Mortgage History
| Date | Status | Borrower | Loan Amount |
|---|---|---|---|
| Open | Howe Loree R | $137,831 | |
| Closed | Albert Loree R | $113,200 |
Source: Public Records
Tax History Compared to Growth
Tax History
| Year | Tax Paid | Tax Assessment Tax Assessment Total Assessment is a certain percentage of the fair market value that is determined by local assessors to be the total taxable value of land and additions on the property. | Land | Improvement |
|---|---|---|---|---|
| 2024 | $3,139 | $130,800 | $36,300 | $94,500 |
| 2023 | $2,917 | $130,800 | $36,300 | $94,500 |
| 2022 | $2,681 | $130,800 | $36,300 | $94,500 |
| 2021 | $2,276 | $130,800 | $36,300 | $94,500 |
| 2020 | $3,190 | $130,800 | $36,300 | $94,500 |
| 2019 | $2,243 | $130,800 | $36,300 | $94,500 |
| 2018 | $0 | $130,800 | $36,300 | $94,500 |
| 2017 | $2,099 | $130,800 | $36,300 | $94,500 |
| 2016 | $2,008 | $130,800 | $36,300 | $94,500 |
| 2015 | $1,864 | $130,800 | $36,300 | $94,500 |
| 2014 | $1,831 | $130,800 | $36,300 | $94,500 |
| 2013 | $1,727 | $130,800 | $36,300 | $94,500 |
Source: Public Records
Map
Nearby Homes