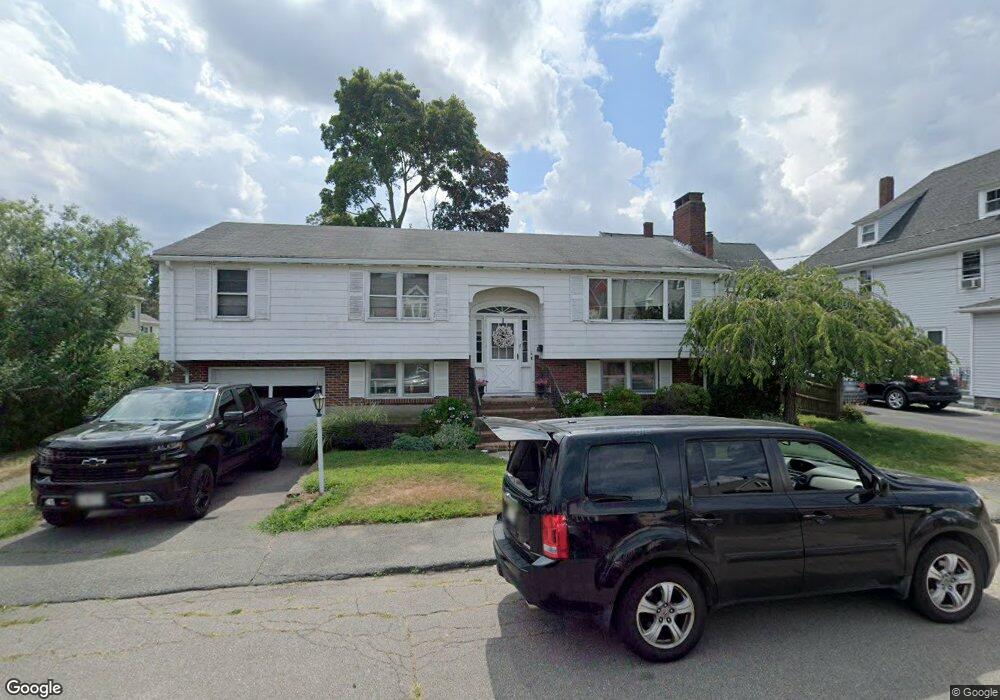
7 Plain St Quincy, MA 02169
South Quincy NeighborhoodEstimated Value: $663,000 - $723,000
3
Beds
2
Baths
1,234
Sq Ft
$561/Sq Ft
Est. Value
About This Home
This home is located at 7 Plain St, Quincy, MA 02169 and is currently estimated at $692,035, approximately $560 per square foot. 7 Plain St is a home located in Norfolk County with nearby schools including South West Middle School, Lincoln-Hancock Community School, and Quincy High School.
Ownership History
Date
Name
Owned For
Owner Type
Purchase Details
Closed on
Aug 30, 1991
Sold by
Balducci Mary E
Bought by
Leo Norman E and Leo Georgia J
Current Estimated Value
Home Financials for this Owner
Home Financials are based on the most recent Mortgage that was taken out on this home.
Original Mortgage
$110,250
Interest Rate
9.44%
Mortgage Type
Purchase Money Mortgage
Create a Home Valuation Report for This Property
The Home Valuation Report is an in-depth analysis detailing your home's value as well as a comparison with similar homes in the area
Home Values in the Area
Average Home Value in this Area
Purchase History
| Date | Buyer | Sale Price | Title Company |
|---|---|---|---|
| Leo Norman E | $147,000 | -- |
Source: Public Records
Mortgage History
| Date | Status | Borrower | Loan Amount |
|---|---|---|---|
| Open | Leo Norman E | $129,016 | |
| Closed | Leo Norman E | $110,250 |
Source: Public Records
Tax History Compared to Growth
Tax History
| Year | Tax Paid | Tax Assessment Tax Assessment Total Assessment is a certain percentage of the fair market value that is determined by local assessors to be the total taxable value of land and additions on the property. | Land | Improvement |
|---|---|---|---|---|
| 2025 | $6,819 | $591,400 | $277,100 | $314,300 |
| 2024 | $6,424 | $570,000 | $263,900 | $306,100 |
| 2023 | $5,788 | $520,000 | $239,900 | $280,100 |
| 2022 | $5,608 | $468,100 | $199,900 | $268,200 |
| 2021 | $5,384 | $443,500 | $199,900 | $243,600 |
| 2020 | $5,165 | $415,500 | $199,900 | $215,600 |
| 2019 | $4,917 | $391,800 | $188,600 | $203,200 |
| 2018 | $4,921 | $368,900 | $174,700 | $194,200 |
| 2017 | $4,687 | $330,800 | $166,400 | $164,400 |
| 2016 | $4,276 | $297,800 | $144,600 | $153,200 |
| 2015 | $4,244 | $290,700 | $144,600 | $146,100 |
| 2014 | $4,143 | $278,800 | $144,600 | $134,200 |
Source: Public Records
Map
Nearby Homes
- 347 Centre St
- 21 Totman St Unit 202
- 21 Totman St Unit 309
- 21 Totman St Unit Model-1
- 21 Totman St Unit 209
- 21 Totman St Unit 203
- 21 Totman St Unit 2
- 56 Penn St Unit 4
- 118 Brook Rd Unit 2
- 72 Federal Ave
- 94 Brook Rd Unit 3
- 192 Federal Ave Unit B
- 177 Franklin St
- 9 Independence Ave Unit 307
- 8 Jackson St Unit B2
- 51 Brook Rd
- 64 Garfield St Unit B
- 50 N Payne St Unit 1
- 50 N Payne St Unit 3
- 91 Garfield St
- 80 Trafford St Unit 2
- 80 Trafford St Unit 1
- 8 Plain St
- 8 Plain St Unit A
- 86 Trafford St
- 207 Liberty St
- 10 Plain St
- 10 Plain St Unit 10
- 10 Plain St
- 10 Plain St Unit 1
- 213 Liberty St
- 68 Trafford St
- 197 Liberty St
- 217 Liberty St
- 79 Trafford St
- 75 Trafford St
- 89 Trafford St
- 69 Trafford St
- 328 Centre St
- 223 Liberty St