Estimated Value: $87,789 - $147,000
--
Bed
1
Bath
1,207
Sq Ft
$99/Sq Ft
Est. Value
About This Home
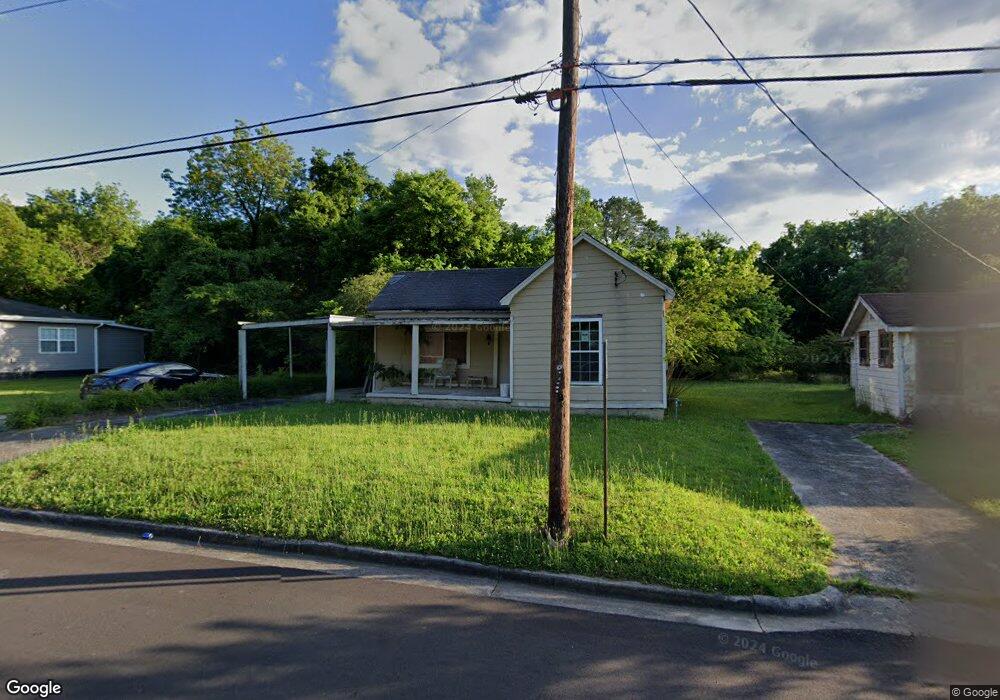
This home is located at 7 Pollock St SW, Rome, GA 30161 and is currently estimated at $119,447, approximately $98 per square foot. 7 Pollock St SW is a home located in Floyd County with nearby schools including Dan McCarty Middle School, Rome High School, and Darlington School.
Ownership History
Date
Name
Owned For
Owner Type
Purchase Details
Closed on
Nov 5, 2013
Sold by
Wade Gladys
Bought by
Bullock Estate
Current Estimated Value
Purchase Details
Closed on
Apr 18, 1984
Sold by
Wade Hugh and Wade Gladys B
Bought by
Wade Gladys
Purchase Details
Closed on
May 4, 1983
Sold by
Administrator Of Veterans Affairs
Bought by
Wade Hugh and Wade Gladys B
Purchase Details
Closed on
Sep 7, 1982
Sold by
Champion Harry Leroy
Bought by
Administrator Of Veterans Affairs
Purchase Details
Closed on
Nov 2, 1979
Sold by
Adm Of V A
Bought by
Champion Harry Leroy
Purchase Details
Closed on
May 18, 1979
Sold by
Billups Ted Lamar
Bought by
Adm Of V A
Purchase Details
Closed on
Aug 21, 1975
Sold by
Adm Of V A
Bought by
Billups Ted Lamar
Purchase Details
Closed on
Dec 5, 1974
Sold by
Mort Securities Inc
Bought by
Adm Of V A
Purchase Details
Closed on
Dec 21, 1972
Sold by
Shirey Nell
Bought by
Builders Realty & Devl
Purchase Details
Closed on
Jan 1, 1901
Bought by
Shirey Nell
Create a Home Valuation Report for This Property
The Home Valuation Report is an in-depth analysis detailing your home's value as well as a comparison with similar homes in the area
Home Values in the Area
Average Home Value in this Area
Purchase History
| Date | Buyer | Sale Price | Title Company |
|---|---|---|---|
| Bullock Estate | $1,478 | -- | |
| Wade Gladys | -- | -- | |
| Wade Hugh | -- | -- | |
| Administrator Of Veterans Affairs | $12,600 | -- | |
| Champion Harry Leroy | $12,000 | -- | |
| Adm Of V A | $13,500 | -- | |
| Billups Ted Lamar | $13,500 | -- | |
| Adm Of V A | -- | -- | |
| Mort Securities Inc | -- | -- | |
| Builders Realty & Devl | $17,000 | -- | |
| Shirey Nell | -- | -- |
Source: Public Records
Tax History Compared to Growth
Tax History
| Year | Tax Paid | Tax Assessment Tax Assessment Total Assessment is a certain percentage of the fair market value that is determined by local assessors to be the total taxable value of land and additions on the property. | Land | Improvement |
|---|---|---|---|---|
| 2024 | $744 | $19,082 | $4,850 | $14,232 |
| 2023 | $676 | $18,018 | $4,410 | $13,608 |
| 2022 | $534 | $14,640 | $3,528 | $11,112 |
| 2021 | $413 | $11,123 | $3,528 | $7,595 |
| 2020 | $369 | $9,862 | $2,756 | $7,106 |
| 2019 | $347 | $9,381 | $2,756 | $6,625 |
| 2018 | $327 | $8,836 | $2,756 | $6,080 |
| 2017 | $316 | $8,540 | $2,756 | $5,784 |
| 2016 | $387 | $10,410 | $2,720 | $7,690 |
| 2015 | -- | $10,410 | $2,720 | $7,690 |
| 2014 | -- | $10,410 | $2,720 | $7,690 |
Source: Public Records
Map
Nearby Homes
- 11 Blacks Bluff Rd SW
- 3 Porter St SW
- 529 Branham Ave SW
- 25 Blacks Bluff Rd SW
- 515 Hardy Ave SW
- 3 Grover St SW
- 410 Hardy Ave SW
- 515 Harper Ave SW
- 5 Jervis St SW
- 107 Butler St SW
- 13 N Blanche Ave SW
- 111 Lookout Cir SW
- 113 Lookout Cir SW
- 115 Lookout Cir SW
- 515 S Broad St SW
- 218 Wilson Ave SW
- 334 Branham Ave SW
- 316 S McLin St SW
- 110 Cherokee St SW
- 5 Pollock St SW
- 9 Pollock St SW
- 11 Pollock St SW
- 3 Pollock St SW
- 0 Pollock St Unit 3255141
- 0 Pollock St
- 13 Pollock St SW
- 6 Pollock St SW
- 12 Peachtree St SW
- 904 S Broad St SW
- 908 S Broad St SW
- 8 Pollock St SW
- 902 S Broad St SW
- 17 Pollock St SW
- 16 Peachtree St SW
- 900 S Broad St SW
- 910 S Broad St SW
- 4 Pollock St SW
- 19 Pollock St SW
- 5 Peachtree St SW