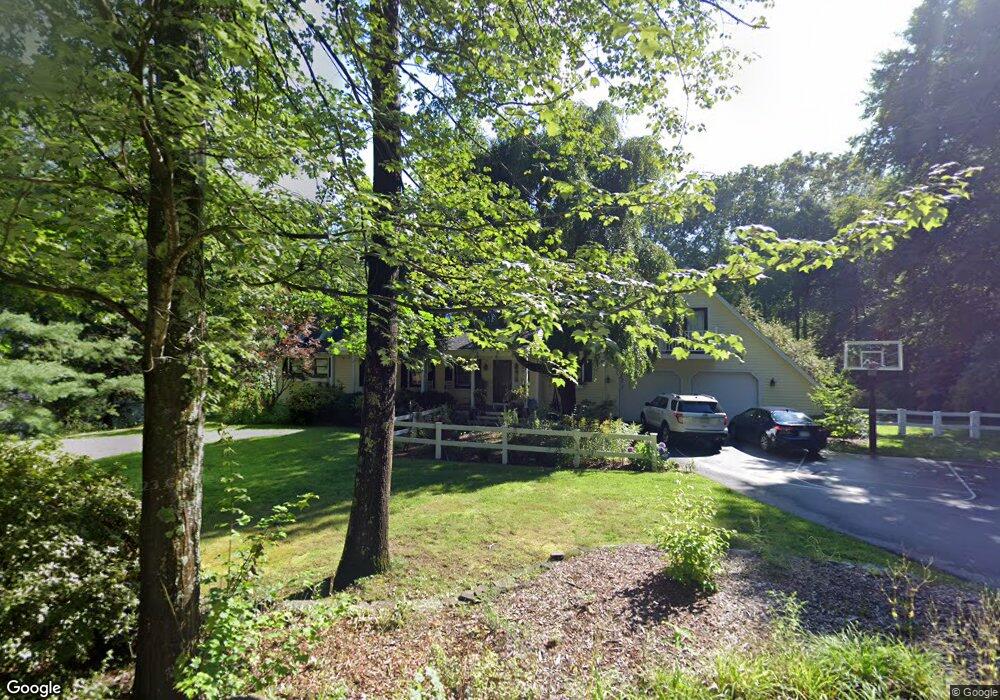
7 Pond St Unit 27 Hopkinton, MA 01748
Estimated Value: $1,078,482 - $1,159,000
2
Beds
3
Baths
2,132
Sq Ft
$529/Sq Ft
Est. Value
About This Home
This home is located at 7 Pond St Unit 27, Hopkinton, MA 01748 and is currently estimated at $1,128,371, approximately $529 per square foot. 7 Pond St Unit 27 is a home located in Middlesex County with nearby schools including Elmwood Elementary School, Hopkins Elementary School, and Marathon Elementary School.
Ownership History
Date
Name
Owned For
Owner Type
Purchase Details
Closed on
Dec 9, 2021
Sold by
Lepage Robert F and Lepage Elizabeth A
Bought by
Lepage Elizabeth A
Current Estimated Value
Home Financials for this Owner
Home Financials are based on the most recent Mortgage that was taken out on this home.
Original Mortgage
$378,000
Outstanding Balance
$348,558
Interest Rate
2.98%
Mortgage Type
Stand Alone Refi Refinance Of Original Loan
Estimated Equity
$779,813
Purchase Details
Closed on
Jun 22, 2012
Sold by
Willett David M and Willett Laura E
Bought by
Lepage Elizabeth A and Lepage Robert F
Home Financials for this Owner
Home Financials are based on the most recent Mortgage that was taken out on this home.
Original Mortgage
$411,500
Interest Rate
3.84%
Mortgage Type
New Conventional
Purchase Details
Closed on
Dec 23, 2002
Sold by
Gaston Thoma Y and Gaston Jill M
Bought by
Willett David M and Willett Laura E
Home Financials for this Owner
Home Financials are based on the most recent Mortgage that was taken out on this home.
Original Mortgage
$484,800
Interest Rate
6.16%
Mortgage Type
Purchase Money Mortgage
Purchase Details
Closed on
Apr 26, 1991
Sold by
Pond Assoc Rt
Bought by
Gaston Thomas Y and Gaston Jill M
Create a Home Valuation Report for This Property
The Home Valuation Report is an in-depth analysis detailing your home's value as well as a comparison with similar homes in the area
Home Values in the Area
Average Home Value in this Area
Purchase History
| Date | Buyer | Sale Price | Title Company |
|---|---|---|---|
| Lepage Elizabeth A | -- | None Available | |
| Lepage Elizabeth A | -- | None Available | |
| Lepage Elizabeth A | $561,500 | -- | |
| Lepage Elizabeth A | $561,500 | -- | |
| Willett David M | $606,000 | -- | |
| Gaston Thomas Y | $266,000 | -- | |
| Willett David M | $606,000 | -- | |
| Gaston Thomas Y | $266,000 | -- |
Source: Public Records
Mortgage History
| Date | Status | Borrower | Loan Amount |
|---|---|---|---|
| Open | Lepage Elizabeth A | $378,000 | |
| Closed | Lepage Elizabeth A | $378,000 | |
| Previous Owner | Lepage Elizabeth A | $411,500 | |
| Previous Owner | Gaston Thomas Y | $0 | |
| Previous Owner | Willett David M | $484,800 |
Source: Public Records
Tax History Compared to Growth
Tax History
| Year | Tax Paid | Tax Assessment Tax Assessment Total Assessment is a certain percentage of the fair market value that is determined by local assessors to be the total taxable value of land and additions on the property. | Land | Improvement |
|---|---|---|---|---|
| 2025 | $12,491 | $880,900 | $366,300 | $514,600 |
| 2024 | $12,328 | $843,800 | $348,900 | $494,900 |
| 2023 | $12,333 | $780,100 | $306,600 | $473,500 |
| 2022 | $12,691 | $745,200 | $279,200 | $466,000 |
| 2021 | $11,683 | $684,000 | $270,900 | $413,100 |
| 2020 | $11,217 | $666,900 | $264,800 | $402,100 |
| 2019 | $10,651 | $620,300 | $254,800 | $365,500 |
| 2018 | $10,125 | $599,100 | $243,000 | $356,100 |
| 2017 | $9,840 | $585,700 | $236,300 | $349,400 |
| 2016 | $9,722 | $570,900 | $231,700 | $339,200 |
| 2015 | $9,749 | $542,800 | $225,200 | $317,600 |
Source: Public Records
Map
Nearby Homes