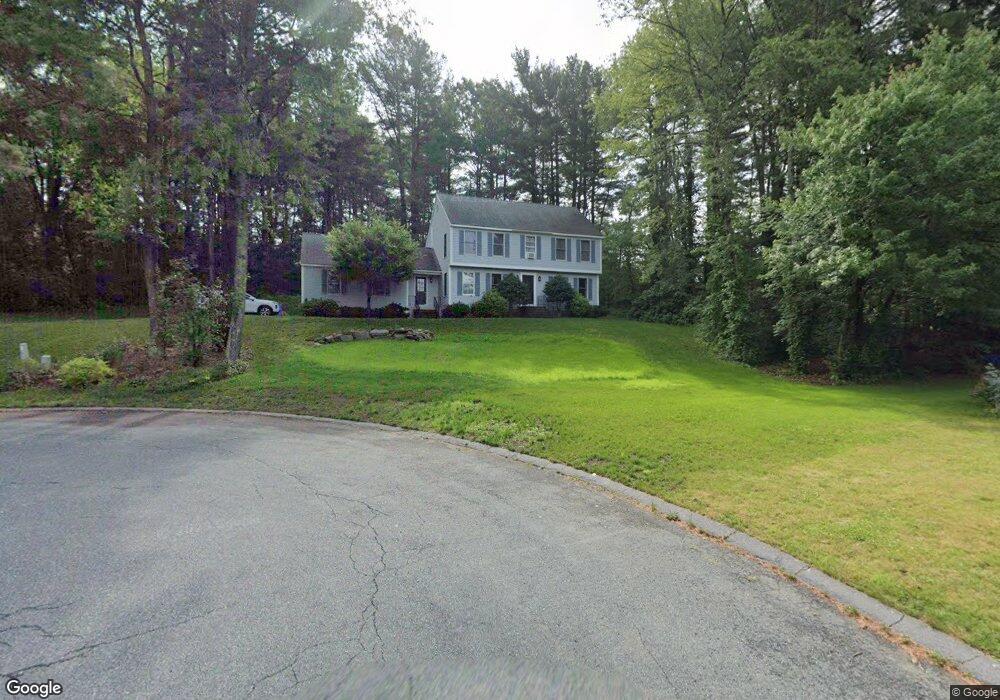
7 Pondville Ct Auburn, MA 01501
Pondville NeighborhoodEstimated Value: $607,876 - $735,000
4
Beds
3
Baths
2,199
Sq Ft
$308/Sq Ft
Est. Value
About This Home
This home is located at 7 Pondville Ct, Auburn, MA 01501 and is currently estimated at $676,969, approximately $307 per square foot. 7 Pondville Ct is a home located in Worcester County with nearby schools including Auburn Senior High School and Shrewsbury Montessori School - Auburn Campus.
Ownership History
Date
Name
Owned For
Owner Type
Purchase Details
Closed on
Feb 7, 2020
Sold by
Mahoney William H and Mahoney Florence B
Bought by
Wozniak Kimberly N
Current Estimated Value
Home Financials for this Owner
Home Financials are based on the most recent Mortgage that was taken out on this home.
Original Mortgage
$387,000
Outstanding Balance
$342,661
Interest Rate
3.6%
Mortgage Type
New Conventional
Estimated Equity
$334,308
Create a Home Valuation Report for This Property
The Home Valuation Report is an in-depth analysis detailing your home's value as well as a comparison with similar homes in the area
Home Values in the Area
Average Home Value in this Area
Purchase History
| Date | Buyer | Sale Price | Title Company |
|---|---|---|---|
| Wozniak Kimberly N | $430,000 | None Available |
Source: Public Records
Mortgage History
| Date | Status | Borrower | Loan Amount |
|---|---|---|---|
| Open | Wozniak Kimberly N | $387,000 |
Source: Public Records
Tax History Compared to Growth
Tax History
| Year | Tax Paid | Tax Assessment Tax Assessment Total Assessment is a certain percentage of the fair market value that is determined by local assessors to be the total taxable value of land and additions on the property. | Land | Improvement |
|---|---|---|---|---|
| 2025 | $72 | $505,100 | $149,000 | $356,100 |
| 2024 | $7,647 | $512,200 | $143,300 | $368,900 |
| 2023 | $7,297 | $459,500 | $130,400 | $329,100 |
| 2022 | $6,824 | $405,700 | $130,400 | $275,300 |
| 2021 | $6,632 | $365,600 | $115,800 | $249,800 |
| 2020 | $6,573 | $365,600 | $115,800 | $249,800 |
| 2019 | $6,379 | $346,300 | $114,100 | $232,200 |
| 2018 | $6,222 | $337,400 | $106,700 | $230,700 |
| 2017 | $6,003 | $327,300 | $96,600 | $230,700 |
| 2016 | $5,780 | $319,500 | $99,800 | $219,700 |
| 2015 | $5,446 | $315,500 | $99,800 | $215,700 |
| 2014 | $5,336 | $308,600 | $95,200 | $213,400 |
Source: Public Records
Map
Nearby Homes